Immigrants from Eastern Asia vs Dominican Vision Disability
COMPARE
Immigrants from Eastern Asia
Dominican
Vision Disability
Vision Disability Comparison
Immigrants from Eastern Asia
Dominicans
1.8%
VISION DISABILITY
100.0/ 100
METRIC RATING
13th/ 347
METRIC RANK
2.6%
VISION DISABILITY
0.0/ 100
METRIC RATING
311th/ 347
METRIC RANK
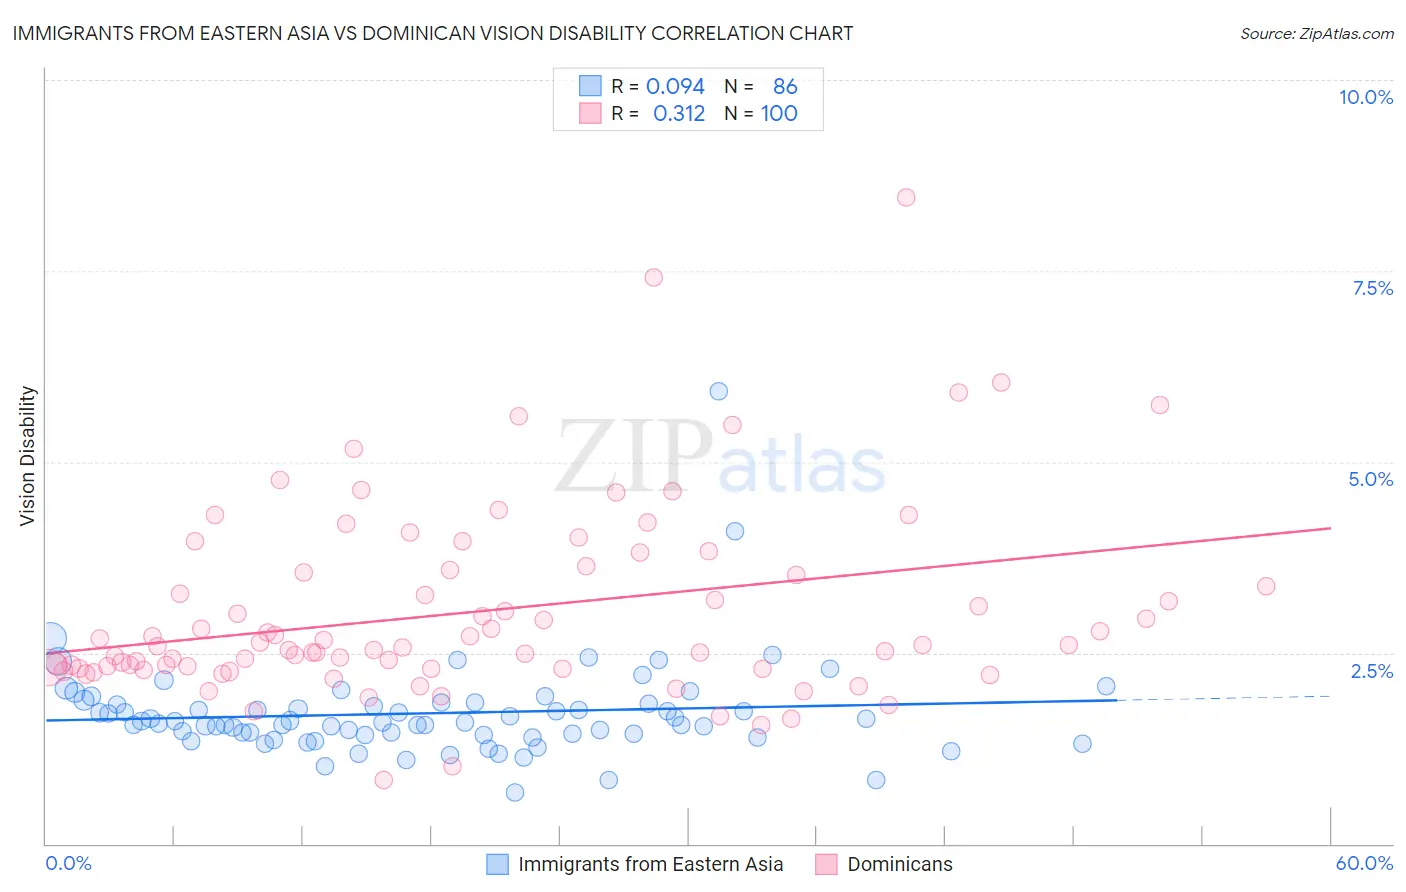
Immigrants from Eastern Asia vs Dominican Vision Disability Correlation Chart
The statistical analysis conducted on geographies consisting of 499,136,938 people shows a slight positive correlation between the proportion of Immigrants from Eastern Asia and percentage of population with vision disability in the United States with a correlation coefficient (R) of 0.094 and weighted average of 1.8%. Similarly, the statistical analysis conducted on geographies consisting of 354,764,822 people shows a mild positive correlation between the proportion of Dominicans and percentage of population with vision disability in the United States with a correlation coefficient (R) of 0.312 and weighted average of 2.6%, a difference of 43.4%.
Vision Disability Correlation Summary
| Measurement | Immigrants from Eastern Asia | Dominican |
| Minimum | 0.68% | 0.84% |
| Maximum | 5.9% | 8.5% |
| Range | 5.2% | 7.6% |
| Mean | 1.7% | 3.0% |
| Median | 1.6% | 2.6% |
| Interquartile 25% (IQ1) | 1.4% | 2.3% |
| Interquartile 75% (IQ3) | 1.8% | 3.6% |
| Interquartile Range (IQR) | 0.40% | 1.3% |
| Standard Deviation (Sample) | 0.65% | 1.3% |
| Standard Deviation (Population) | 0.65% | 1.3% |
Similar Demographics by Vision Disability
Demographics Similar to Immigrants from Eastern Asia by Vision Disability
In terms of vision disability, the demographic groups most similar to Immigrants from Eastern Asia are Immigrants from Korea (1.8%, a difference of 0.080%), Immigrants from China (1.8%, a difference of 0.15%), Immigrants from Israel (1.8%, a difference of 0.31%), Immigrants from Bolivia (1.8%, a difference of 0.57%), and Indian (Asian) (1.8%, a difference of 1.0%).
| Demographics | Rating | Rank | Vision Disability |
| Immigrants | Iran | 100.0 /100 | #6 | Exceptional 1.8% |
| Immigrants | South Central Asia | 100.0 /100 | #7 | Exceptional 1.8% |
| Iranians | 100.0 /100 | #8 | Exceptional 1.8% |
| Immigrants | Singapore | 100.0 /100 | #9 | Exceptional 1.8% |
| Immigrants | Hong Kong | 100.0 /100 | #10 | Exceptional 1.8% |
| Immigrants | Israel | 100.0 /100 | #11 | Exceptional 1.8% |
| Immigrants | Korea | 100.0 /100 | #12 | Exceptional 1.8% |
| Immigrants | Eastern Asia | 100.0 /100 | #13 | Exceptional 1.8% |
| Immigrants | China | 100.0 /100 | #14 | Exceptional 1.8% |
| Immigrants | Bolivia | 100.0 /100 | #15 | Exceptional 1.8% |
| Indians (Asian) | 100.0 /100 | #16 | Exceptional 1.8% |
| Burmese | 100.0 /100 | #17 | Exceptional 1.8% |
| Bolivians | 100.0 /100 | #18 | Exceptional 1.9% |
| Immigrants | Sri Lanka | 100.0 /100 | #19 | Exceptional 1.9% |
| Asians | 100.0 /100 | #20 | Exceptional 1.9% |
Demographics Similar to Dominicans by Vision Disability
In terms of vision disability, the demographic groups most similar to Dominicans are Blackfeet (2.6%, a difference of 0.040%), Immigrants from Yemen (2.6%, a difference of 0.37%), Arapaho (2.6%, a difference of 0.65%), Immigrants from Dominican Republic (2.6%, a difference of 0.67%), and Iroquois (2.6%, a difference of 0.70%).
| Demographics | Rating | Rank | Vision Disability |
| Aleuts | 0.0 /100 | #304 | Tragic 2.6% |
| Hispanics or Latinos | 0.0 /100 | #305 | Tragic 2.6% |
| Iroquois | 0.0 /100 | #306 | Tragic 2.6% |
| Immigrants | Dominican Republic | 0.0 /100 | #307 | Tragic 2.6% |
| Arapaho | 0.0 /100 | #308 | Tragic 2.6% |
| Immigrants | Yemen | 0.0 /100 | #309 | Tragic 2.6% |
| Blackfeet | 0.0 /100 | #310 | Tragic 2.6% |
| Dominicans | 0.0 /100 | #311 | Tragic 2.6% |
| Americans | 0.0 /100 | #312 | Tragic 2.6% |
| Potawatomi | 0.0 /100 | #313 | Tragic 2.6% |
| Inupiat | 0.0 /100 | #314 | Tragic 2.7% |
| Osage | 0.0 /100 | #315 | Tragic 2.7% |
| Shoshone | 0.0 /100 | #316 | Tragic 2.7% |
| Yup'ik | 0.0 /100 | #317 | Tragic 2.7% |
| Alaska Natives | 0.0 /100 | #318 | Tragic 2.7% |