South American Indian vs Dominican Disability
COMPARE
South American Indian
Dominican
Disability
Disability Comparison
South American Indians
Dominicans
11.4%
DISABILITY
92.2/ 100
METRIC RATING
124th/ 347
METRIC RANK
12.7%
DISABILITY
0.0/ 100
METRIC RATING
272nd/ 347
METRIC RANK
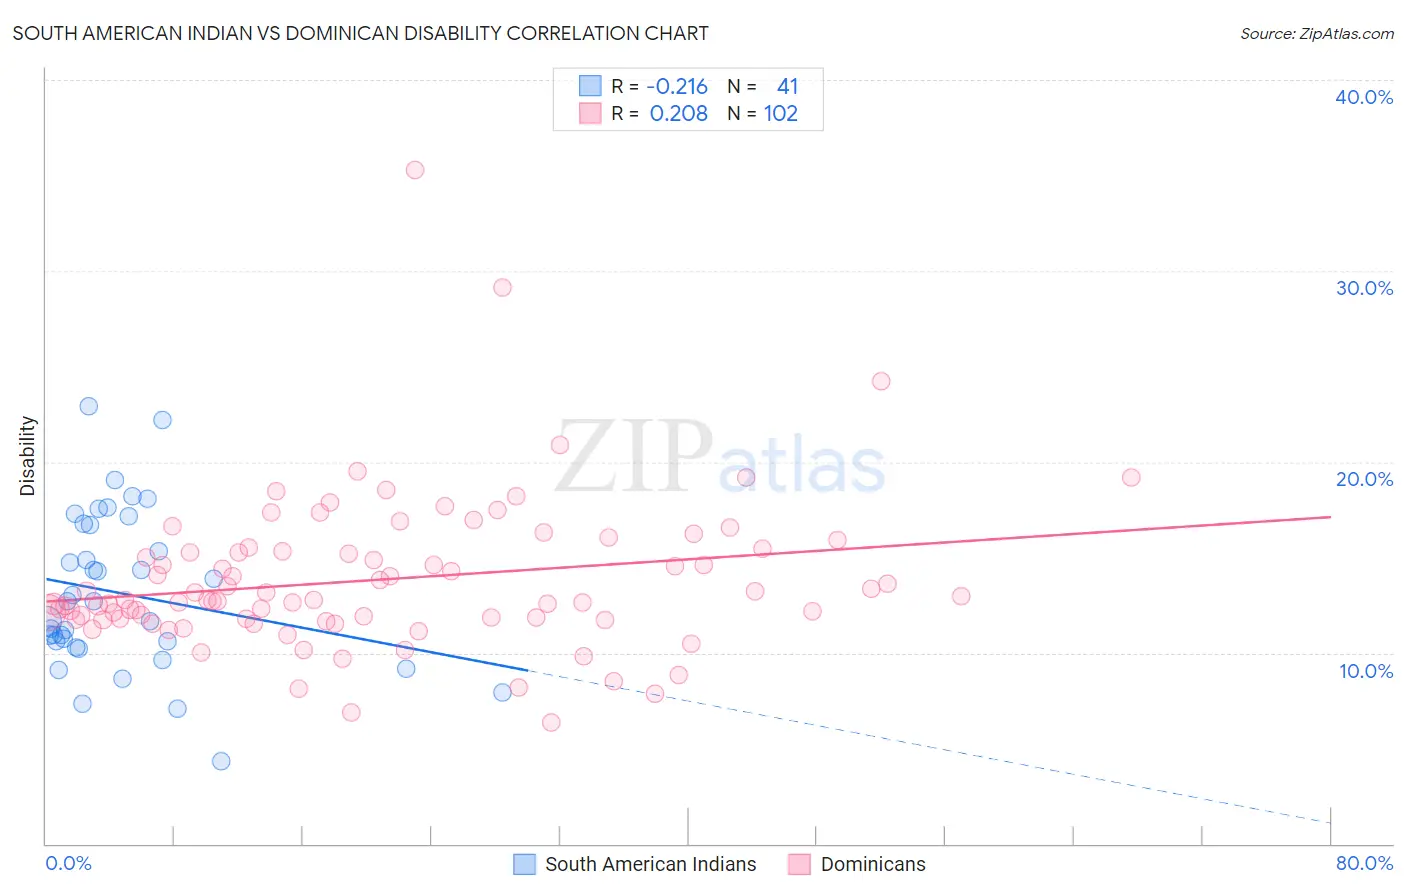
South American Indian vs Dominican Disability Correlation Chart
The statistical analysis conducted on geographies consisting of 164,561,915 people shows a weak negative correlation between the proportion of South American Indians and percentage of population with a disability in the United States with a correlation coefficient (R) of -0.216 and weighted average of 11.4%. Similarly, the statistical analysis conducted on geographies consisting of 355,062,868 people shows a weak positive correlation between the proportion of Dominicans and percentage of population with a disability in the United States with a correlation coefficient (R) of 0.208 and weighted average of 12.7%, a difference of 11.5%.
Disability Correlation Summary
| Measurement | South American Indian | Dominican |
| Minimum | 4.3% | 6.4% |
| Maximum | 22.9% | 35.3% |
| Range | 18.6% | 28.9% |
| Mean | 13.1% | 13.8% |
| Median | 12.7% | 12.8% |
| Interquartile 25% (IQ1) | 10.4% | 11.8% |
| Interquartile 75% (IQ3) | 16.7% | 15.3% |
| Interquartile Range (IQR) | 6.3% | 3.5% |
| Standard Deviation (Sample) | 4.1% | 4.0% |
| Standard Deviation (Population) | 4.1% | 4.0% |
Similar Demographics by Disability
Demographics Similar to South American Indians by Disability
In terms of disability, the demographic groups most similar to South American Indians are South African (11.4%, a difference of 0.020%), Costa Rican (11.4%, a difference of 0.040%), Brazilian (11.4%, a difference of 0.19%), Immigrants from Latvia (11.4%, a difference of 0.19%), and Immigrants from North Macedonia (11.4%, a difference of 0.22%).
| Demographics | Rating | Rank | Disability |
| Luxembourgers | 93.9 /100 | #117 | Exceptional 11.3% |
| Koreans | 93.8 /100 | #118 | Exceptional 11.3% |
| Central Americans | 93.5 /100 | #119 | Exceptional 11.4% |
| Immigrants | North Macedonia | 93.5 /100 | #120 | Exceptional 11.4% |
| Immigrants | Costa Rica | 93.4 /100 | #121 | Exceptional 11.4% |
| Brazilians | 93.3 /100 | #122 | Exceptional 11.4% |
| South Africans | 92.3 /100 | #123 | Exceptional 11.4% |
| South American Indians | 92.2 /100 | #124 | Exceptional 11.4% |
| Costa Ricans | 91.9 /100 | #125 | Exceptional 11.4% |
| Immigrants | Latvia | 90.9 /100 | #126 | Exceptional 11.4% |
| Immigrants | Italy | 90.4 /100 | #127 | Exceptional 11.4% |
| Immigrants | Europe | 90.4 /100 | #128 | Exceptional 11.4% |
| Macedonians | 90.3 /100 | #129 | Exceptional 11.4% |
| Latvians | 89.8 /100 | #130 | Excellent 11.4% |
| Immigrants | Croatia | 89.8 /100 | #131 | Excellent 11.4% |
Demographics Similar to Dominicans by Disability
In terms of disability, the demographic groups most similar to Dominicans are Finnish (12.7%, a difference of 0.16%), Immigrants from Yemen (12.6%, a difference of 0.49%), Portuguese (12.6%, a difference of 0.54%), Nepalese (12.8%, a difference of 0.60%), and Sioux (12.8%, a difference of 0.68%).
| Demographics | Rating | Rank | Disability |
| U.S. Virgin Islanders | 0.2 /100 | #265 | Tragic 12.5% |
| Czechoslovakians | 0.2 /100 | #266 | Tragic 12.5% |
| Spaniards | 0.2 /100 | #267 | Tragic 12.5% |
| Bangladeshis | 0.1 /100 | #268 | Tragic 12.6% |
| Immigrants | Dominican Republic | 0.1 /100 | #269 | Tragic 12.6% |
| Portuguese | 0.1 /100 | #270 | Tragic 12.6% |
| Immigrants | Yemen | 0.1 /100 | #271 | Tragic 12.6% |
| Dominicans | 0.0 /100 | #272 | Tragic 12.7% |
| Finns | 0.0 /100 | #273 | Tragic 12.7% |
| Nepalese | 0.0 /100 | #274 | Tragic 12.8% |
| Sioux | 0.0 /100 | #275 | Tragic 12.8% |
| Hmong | 0.0 /100 | #276 | Tragic 12.8% |
| Dutch | 0.0 /100 | #277 | Tragic 12.8% |
| Germans | 0.0 /100 | #278 | Tragic 12.8% |
| Fijians | 0.0 /100 | #279 | Tragic 12.8% |