Immigrants from Eastern Asia vs Croatian Disability Age Under 5
COMPARE
Immigrants from Eastern Asia
Croatian
Disability Age Under 5
Disability Age Under 5 Comparison
Immigrants from Eastern Asia
Croatians
1.0%
DISABILITY AGE UNDER 5
100.0/ 100
METRIC RATING
28th/ 347
METRIC RANK
1.5%
DISABILITY AGE UNDER 5
0.0/ 100
METRIC RATING
285th/ 347
METRIC RANK
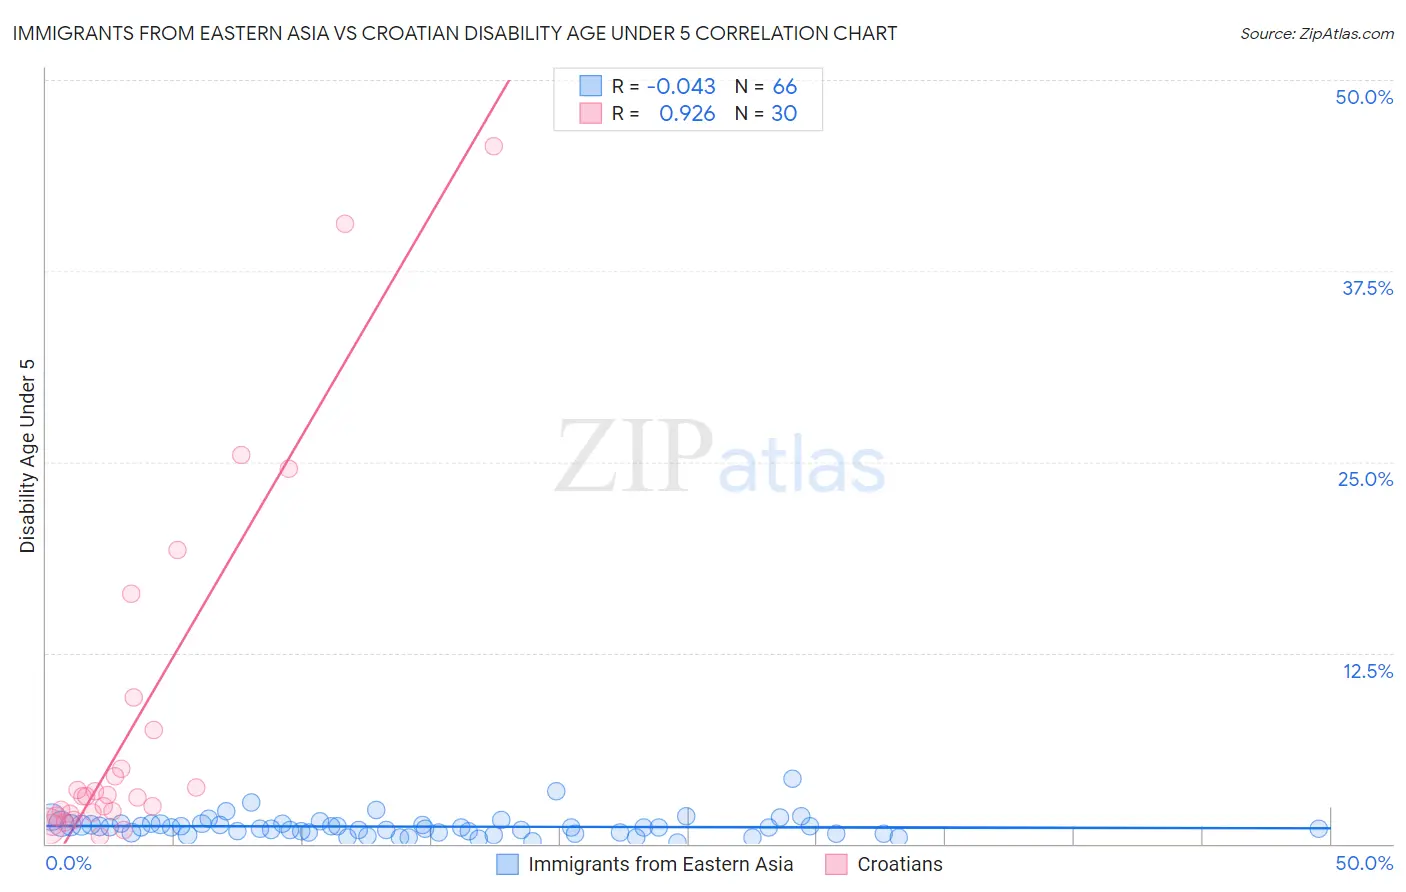
Immigrants from Eastern Asia vs Croatian Disability Age Under 5 Correlation Chart
The statistical analysis conducted on geographies consisting of 247,629,306 people shows no correlation between the proportion of Immigrants from Eastern Asia and percentage of population with a disability under the age of 5 in the United States with a correlation coefficient (R) of -0.043 and weighted average of 1.0%. Similarly, the statistical analysis conducted on geographies consisting of 201,433,787 people shows a near-perfect positive correlation between the proportion of Croatians and percentage of population with a disability under the age of 5 in the United States with a correlation coefficient (R) of 0.926 and weighted average of 1.5%, a difference of 50.6%.
Disability Age Under 5 Correlation Summary
| Measurement | Immigrants from Eastern Asia | Croatian |
| Minimum | 0.058% | 0.50% |
| Maximum | 4.2% | 45.7% |
| Range | 4.2% | 45.2% |
| Mean | 1.1% | 8.1% |
| Median | 1.1% | 3.1% |
| Interquartile 25% (IQ1) | 0.74% | 1.9% |
| Interquartile 75% (IQ3) | 1.3% | 7.5% |
| Interquartile Range (IQR) | 0.54% | 5.5% |
| Standard Deviation (Sample) | 0.69% | 11.7% |
| Standard Deviation (Population) | 0.69% | 11.5% |
Similar Demographics by Disability Age Under 5
Demographics Similar to Immigrants from Eastern Asia by Disability Age Under 5
In terms of disability age under 5, the demographic groups most similar to Immigrants from Eastern Asia are Immigrants from Belarus (1.0%, a difference of 0.12%), Guyanese (1.0%, a difference of 0.63%), Immigrants from South Central Asia (1.0%, a difference of 0.65%), Armenian (1.0%, a difference of 0.93%), and Iranian (1.0%, a difference of 0.98%).
| Demographics | Rating | Rank | Disability Age Under 5 |
| British West Indians | 100.0 /100 | #21 | Exceptional 0.99% |
| Immigrants | Iran | 100.0 /100 | #22 | Exceptional 1.00% |
| Yakama | 100.0 /100 | #23 | Exceptional 1.00% |
| Indians (Asian) | 100.0 /100 | #24 | Exceptional 1.0% |
| Immigrants | Micronesia | 100.0 /100 | #25 | Exceptional 1.0% |
| Immigrants | Taiwan | 100.0 /100 | #26 | Exceptional 1.0% |
| Guyanese | 100.0 /100 | #27 | Exceptional 1.0% |
| Immigrants | Eastern Asia | 100.0 /100 | #28 | Exceptional 1.0% |
| Immigrants | Belarus | 100.0 /100 | #29 | Exceptional 1.0% |
| Immigrants | South Central Asia | 99.9 /100 | #30 | Exceptional 1.0% |
| Armenians | 99.9 /100 | #31 | Exceptional 1.0% |
| Iranians | 99.9 /100 | #32 | Exceptional 1.0% |
| Bolivians | 99.9 /100 | #33 | Exceptional 1.0% |
| Immigrants | Ukraine | 99.9 /100 | #34 | Exceptional 1.0% |
| Barbadians | 99.9 /100 | #35 | Exceptional 1.0% |
Demographics Similar to Croatians by Disability Age Under 5
In terms of disability age under 5, the demographic groups most similar to Croatians are Tlingit-Haida (1.5%, a difference of 0.25%), Scandinavian (1.5%, a difference of 0.30%), Estonian (1.5%, a difference of 0.49%), Hungarian (1.5%, a difference of 0.63%), and Czech (1.5%, a difference of 0.75%).
| Demographics | Rating | Rank | Disability Age Under 5 |
| Kiowa | 0.0 /100 | #278 | Tragic 1.5% |
| Danes | 0.0 /100 | #279 | Tragic 1.5% |
| British | 0.0 /100 | #280 | Tragic 1.5% |
| Czechoslovakians | 0.0 /100 | #281 | Tragic 1.5% |
| Cheyenne | 0.0 /100 | #282 | Tragic 1.5% |
| Delaware | 0.0 /100 | #283 | Tragic 1.5% |
| Europeans | 0.0 /100 | #284 | Tragic 1.5% |
| Croatians | 0.0 /100 | #285 | Tragic 1.5% |
| Tlingit-Haida | 0.0 /100 | #286 | Tragic 1.5% |
| Scandinavians | 0.0 /100 | #287 | Tragic 1.5% |
| Estonians | 0.0 /100 | #288 | Tragic 1.5% |
| Hungarians | 0.0 /100 | #289 | Tragic 1.5% |
| Czechs | 0.0 /100 | #290 | Tragic 1.5% |
| Northern Europeans | 0.0 /100 | #291 | Tragic 1.6% |
| Italians | 0.0 /100 | #292 | Tragic 1.6% |