Immigrants from Eastern Asia vs Norwegian Disability Age Under 5
COMPARE
Immigrants from Eastern Asia
Norwegian
Disability Age Under 5
Disability Age Under 5 Comparison
Immigrants from Eastern Asia
Norwegians
1.0%
DISABILITY AGE UNDER 5
100.0/ 100
METRIC RATING
28th/ 347
METRIC RANK
1.7%
DISABILITY AGE UNDER 5
0.0/ 100
METRIC RATING
314th/ 347
METRIC RANK
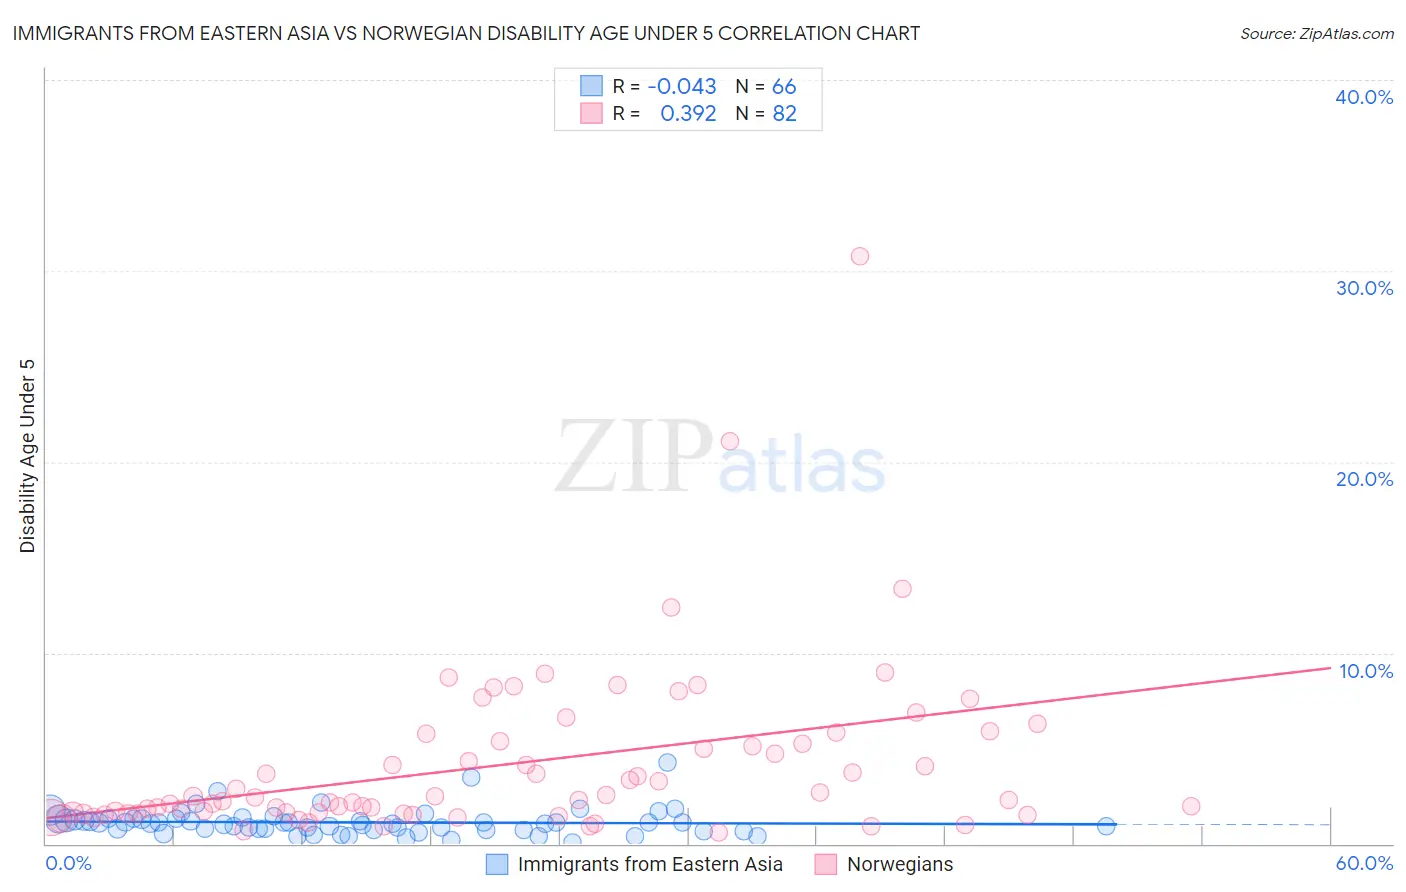
Immigrants from Eastern Asia vs Norwegian Disability Age Under 5 Correlation Chart
The statistical analysis conducted on geographies consisting of 247,629,306 people shows no correlation between the proportion of Immigrants from Eastern Asia and percentage of population with a disability under the age of 5 in the United States with a correlation coefficient (R) of -0.043 and weighted average of 1.0%. Similarly, the statistical analysis conducted on geographies consisting of 251,234,547 people shows a mild positive correlation between the proportion of Norwegians and percentage of population with a disability under the age of 5 in the United States with a correlation coefficient (R) of 0.392 and weighted average of 1.7%, a difference of 64.2%.
Disability Age Under 5 Correlation Summary
| Measurement | Immigrants from Eastern Asia | Norwegian |
| Minimum | 0.058% | 0.60% |
| Maximum | 4.2% | 30.8% |
| Range | 4.2% | 30.2% |
| Mean | 1.1% | 4.2% |
| Median | 1.1% | 2.4% |
| Interquartile 25% (IQ1) | 0.74% | 1.6% |
| Interquartile 75% (IQ3) | 1.3% | 5.4% |
| Interquartile Range (IQR) | 0.54% | 3.8% |
| Standard Deviation (Sample) | 0.69% | 4.5% |
| Standard Deviation (Population) | 0.69% | 4.5% |
Similar Demographics by Disability Age Under 5
Demographics Similar to Immigrants from Eastern Asia by Disability Age Under 5
In terms of disability age under 5, the demographic groups most similar to Immigrants from Eastern Asia are Immigrants from Belarus (1.0%, a difference of 0.12%), Guyanese (1.0%, a difference of 0.63%), Immigrants from South Central Asia (1.0%, a difference of 0.65%), Armenian (1.0%, a difference of 0.93%), and Iranian (1.0%, a difference of 0.98%).
| Demographics | Rating | Rank | Disability Age Under 5 |
| British West Indians | 100.0 /100 | #21 | Exceptional 0.99% |
| Immigrants | Iran | 100.0 /100 | #22 | Exceptional 1.00% |
| Yakama | 100.0 /100 | #23 | Exceptional 1.00% |
| Indians (Asian) | 100.0 /100 | #24 | Exceptional 1.0% |
| Immigrants | Micronesia | 100.0 /100 | #25 | Exceptional 1.0% |
| Immigrants | Taiwan | 100.0 /100 | #26 | Exceptional 1.0% |
| Guyanese | 100.0 /100 | #27 | Exceptional 1.0% |
| Immigrants | Eastern Asia | 100.0 /100 | #28 | Exceptional 1.0% |
| Immigrants | Belarus | 100.0 /100 | #29 | Exceptional 1.0% |
| Immigrants | South Central Asia | 99.9 /100 | #30 | Exceptional 1.0% |
| Armenians | 99.9 /100 | #31 | Exceptional 1.0% |
| Iranians | 99.9 /100 | #32 | Exceptional 1.0% |
| Bolivians | 99.9 /100 | #33 | Exceptional 1.0% |
| Immigrants | Ukraine | 99.9 /100 | #34 | Exceptional 1.0% |
| Barbadians | 99.9 /100 | #35 | Exceptional 1.0% |
Demographics Similar to Norwegians by Disability Age Under 5
In terms of disability age under 5, the demographic groups most similar to Norwegians are Celtic (1.7%, a difference of 0.16%), Dutch (1.7%, a difference of 0.26%), Puerto Rican (1.7%, a difference of 0.32%), English (1.7%, a difference of 0.36%), and Immigrants from Cabo Verde (1.7%, a difference of 0.44%).
| Demographics | Rating | Rank | Disability Age Under 5 |
| Scottish | 0.0 /100 | #307 | Tragic 1.6% |
| Navajo | 0.0 /100 | #308 | Tragic 1.6% |
| Cape Verdeans | 0.0 /100 | #309 | Tragic 1.7% |
| Whites/Caucasians | 0.0 /100 | #310 | Tragic 1.7% |
| English | 0.0 /100 | #311 | Tragic 1.7% |
| Puerto Ricans | 0.0 /100 | #312 | Tragic 1.7% |
| Celtics | 0.0 /100 | #313 | Tragic 1.7% |
| Norwegians | 0.0 /100 | #314 | Tragic 1.7% |
| Dutch | 0.0 /100 | #315 | Tragic 1.7% |
| Immigrants | Cabo Verde | 0.0 /100 | #316 | Tragic 1.7% |
| French | 0.0 /100 | #317 | Tragic 1.7% |
| Irish | 0.0 /100 | #318 | Tragic 1.7% |
| Slovaks | 0.0 /100 | #319 | Tragic 1.7% |
| Scotch-Irish | 0.0 /100 | #320 | Tragic 1.7% |
| Ottawa | 0.0 /100 | #321 | Tragic 1.7% |