Paraguayan vs Croatian Disability Age Under 5
COMPARE
Paraguayan
Croatian
Disability Age Under 5
Disability Age Under 5 Comparison
Paraguayans
Croatians
2.0%
DISABILITY AGE UNDER 5
0.0/ 100
METRIC RATING
336th/ 347
METRIC RANK
1.5%
DISABILITY AGE UNDER 5
0.0/ 100
METRIC RATING
285th/ 347
METRIC RANK
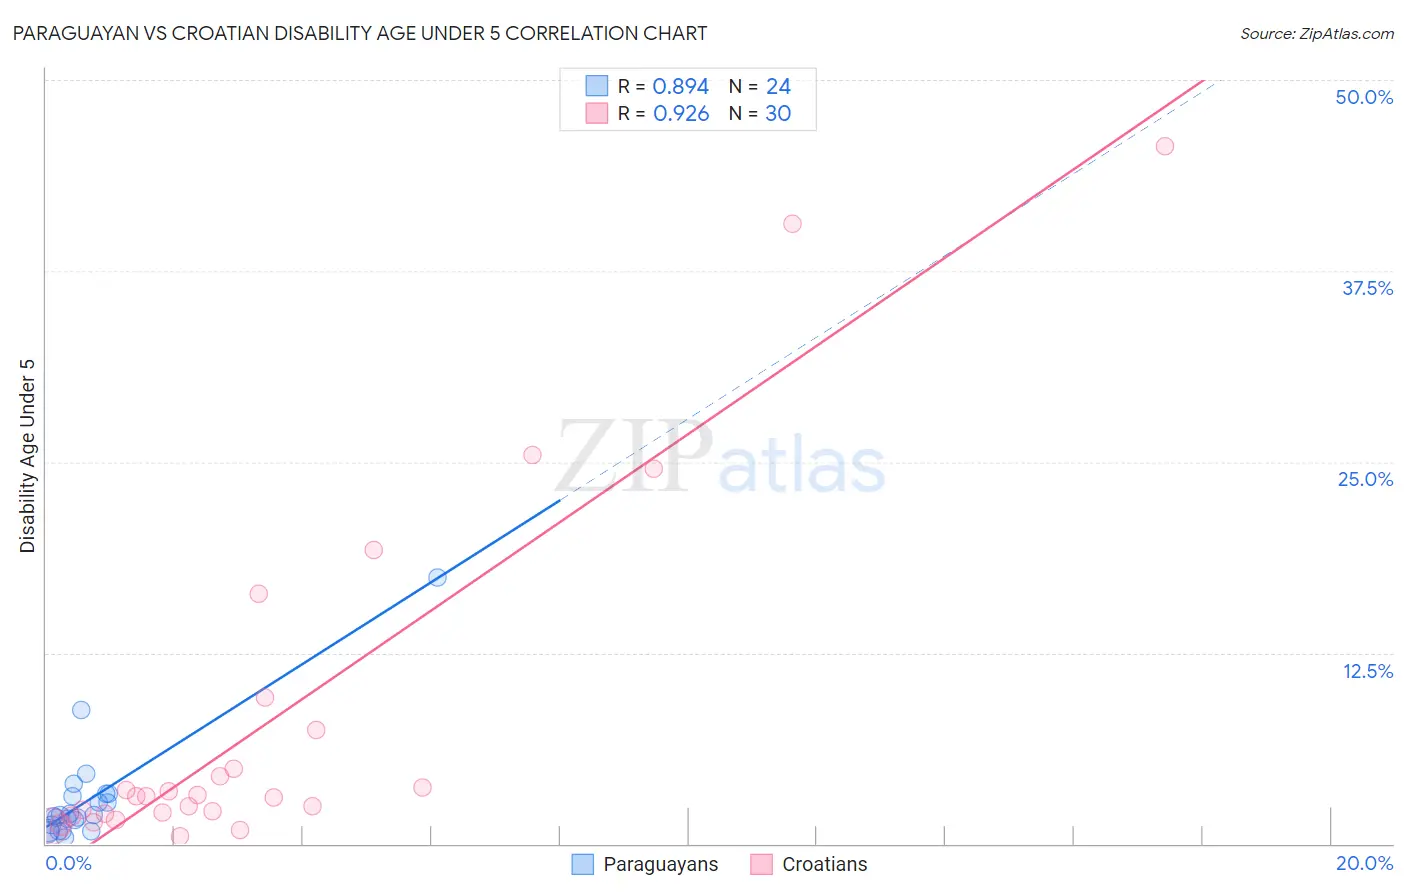
Paraguayan vs Croatian Disability Age Under 5 Correlation Chart
The statistical analysis conducted on geographies consisting of 72,027,201 people shows a very strong positive correlation between the proportion of Paraguayans and percentage of population with a disability under the age of 5 in the United States with a correlation coefficient (R) of 0.894 and weighted average of 2.0%. Similarly, the statistical analysis conducted on geographies consisting of 201,433,787 people shows a near-perfect positive correlation between the proportion of Croatians and percentage of population with a disability under the age of 5 in the United States with a correlation coefficient (R) of 0.926 and weighted average of 1.5%, a difference of 28.4%.
Disability Age Under 5 Correlation Summary
| Measurement | Paraguayan | Croatian |
| Minimum | 0.40% | 0.50% |
| Maximum | 17.4% | 45.7% |
| Range | 17.0% | 45.2% |
| Mean | 2.9% | 8.1% |
| Median | 1.8% | 3.1% |
| Interquartile 25% (IQ1) | 1.1% | 1.9% |
| Interquartile 75% (IQ3) | 3.2% | 7.5% |
| Interquartile Range (IQR) | 2.1% | 5.5% |
| Standard Deviation (Sample) | 3.6% | 11.7% |
| Standard Deviation (Population) | 3.5% | 11.5% |
Similar Demographics by Disability Age Under 5
Demographics Similar to Paraguayans by Disability Age Under 5
In terms of disability age under 5, the demographic groups most similar to Paraguayans are Pennsylvania German (1.9%, a difference of 1.3%), Native/Alaskan (1.9%, a difference of 1.7%), Dutch West Indian (1.9%, a difference of 2.1%), Apache (2.0%, a difference of 2.9%), and Chippewa (1.9%, a difference of 5.1%).
| Demographics | Rating | Rank | Disability Age Under 5 |
| Houma | 0.0 /100 | #329 | Tragic 1.9% |
| Choctaw | 0.0 /100 | #330 | Tragic 1.9% |
| French Canadians | 0.0 /100 | #331 | Tragic 1.9% |
| Chippewa | 0.0 /100 | #332 | Tragic 1.9% |
| Dutch West Indians | 0.0 /100 | #333 | Tragic 1.9% |
| Natives/Alaskans | 0.0 /100 | #334 | Tragic 1.9% |
| Pennsylvania Germans | 0.0 /100 | #335 | Tragic 1.9% |
| Paraguayans | 0.0 /100 | #336 | Tragic 2.0% |
| Apache | 0.0 /100 | #337 | Tragic 2.0% |
| Tohono O'odham | 0.0 /100 | #338 | Tragic 2.2% |
| Immigrants | Azores | 0.0 /100 | #339 | Tragic 2.2% |
| Menominee | 0.0 /100 | #340 | Tragic 2.3% |
| Tsimshian | 0.0 /100 | #341 | Tragic 2.4% |
| Alaska Natives | 0.0 /100 | #342 | Tragic 2.9% |
| Colville | 0.0 /100 | #343 | Tragic 3.3% |
Demographics Similar to Croatians by Disability Age Under 5
In terms of disability age under 5, the demographic groups most similar to Croatians are Tlingit-Haida (1.5%, a difference of 0.25%), Scandinavian (1.5%, a difference of 0.30%), Estonian (1.5%, a difference of 0.49%), Hungarian (1.5%, a difference of 0.63%), and Czech (1.5%, a difference of 0.75%).
| Demographics | Rating | Rank | Disability Age Under 5 |
| Kiowa | 0.0 /100 | #278 | Tragic 1.5% |
| Danes | 0.0 /100 | #279 | Tragic 1.5% |
| British | 0.0 /100 | #280 | Tragic 1.5% |
| Czechoslovakians | 0.0 /100 | #281 | Tragic 1.5% |
| Cheyenne | 0.0 /100 | #282 | Tragic 1.5% |
| Delaware | 0.0 /100 | #283 | Tragic 1.5% |
| Europeans | 0.0 /100 | #284 | Tragic 1.5% |
| Croatians | 0.0 /100 | #285 | Tragic 1.5% |
| Tlingit-Haida | 0.0 /100 | #286 | Tragic 1.5% |
| Scandinavians | 0.0 /100 | #287 | Tragic 1.5% |
| Estonians | 0.0 /100 | #288 | Tragic 1.5% |
| Hungarians | 0.0 /100 | #289 | Tragic 1.5% |
| Czechs | 0.0 /100 | #290 | Tragic 1.5% |
| Northern Europeans | 0.0 /100 | #291 | Tragic 1.6% |
| Italians | 0.0 /100 | #292 | Tragic 1.6% |