Immigrants from Denmark vs Nigerian Associate's Degree
COMPARE
Immigrants from Denmark
Nigerian
Associate's Degree
Associate's Degree Comparison
Immigrants from Denmark
Nigerians
53.1%
ASSOCIATE'S DEGREE
100.0/ 100
METRIC RATING
37th/ 347
METRIC RANK
45.1%
ASSOCIATE'S DEGREE
19.1/ 100
METRIC RATING
204th/ 347
METRIC RANK
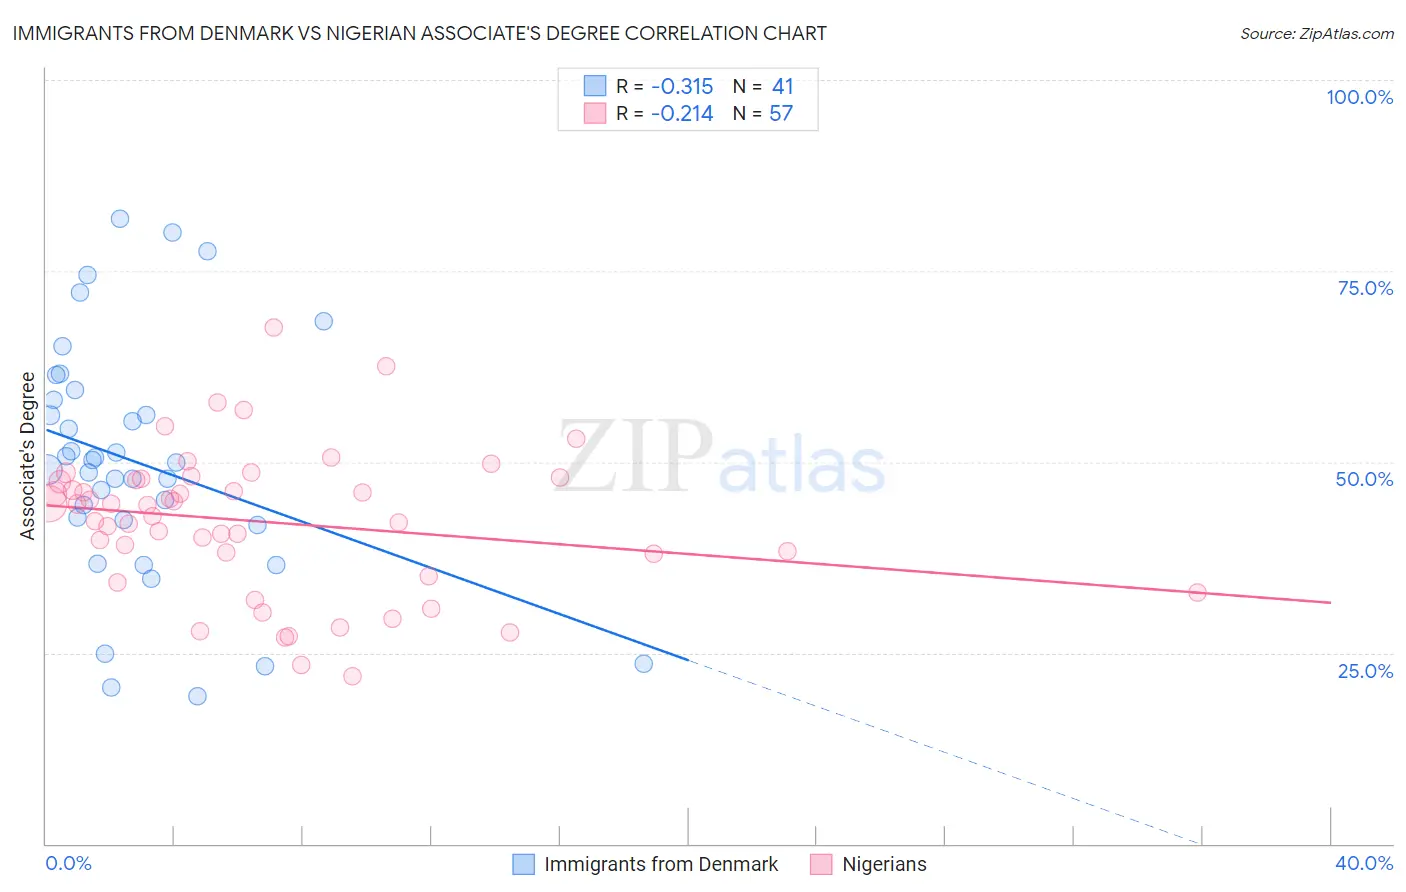
Immigrants from Denmark vs Nigerian Associate's Degree Correlation Chart
The statistical analysis conducted on geographies consisting of 136,428,731 people shows a mild negative correlation between the proportion of Immigrants from Denmark and percentage of population with at least associate's degree education in the United States with a correlation coefficient (R) of -0.315 and weighted average of 53.1%. Similarly, the statistical analysis conducted on geographies consisting of 332,751,702 people shows a weak negative correlation between the proportion of Nigerians and percentage of population with at least associate's degree education in the United States with a correlation coefficient (R) of -0.214 and weighted average of 45.1%, a difference of 17.6%.
Associate's Degree Correlation Summary
| Measurement | Immigrants from Denmark | Nigerian |
| Minimum | 19.3% | 22.0% |
| Maximum | 81.9% | 67.5% |
| Range | 62.5% | 45.6% |
| Mean | 49.9% | 42.1% |
| Median | 50.0% | 44.3% |
| Interquartile 25% (IQ1) | 42.1% | 36.5% |
| Interquartile 75% (IQ3) | 58.7% | 47.7% |
| Interquartile Range (IQR) | 16.6% | 11.2% |
| Standard Deviation (Sample) | 15.6% | 9.4% |
| Standard Deviation (Population) | 15.4% | 9.4% |
Similar Demographics by Associate's Degree
Demographics Similar to Immigrants from Denmark by Associate's Degree
In terms of associate's degree, the demographic groups most similar to Immigrants from Denmark are Immigrants from Russia (53.1%, a difference of 0.080%), Mongolian (53.0%, a difference of 0.16%), Russian (53.2%, a difference of 0.36%), Bulgarian (53.3%, a difference of 0.43%), and Immigrants from Belarus (52.8%, a difference of 0.45%).
| Demographics | Rating | Rank | Associate's Degree |
| Immigrants | Sri Lanka | 100.0 /100 | #30 | Exceptional 53.7% |
| Immigrants | Northern Europe | 100.0 /100 | #31 | Exceptional 53.5% |
| Immigrants | Turkey | 100.0 /100 | #32 | Exceptional 53.4% |
| Israelis | 100.0 /100 | #33 | Exceptional 53.4% |
| Bulgarians | 100.0 /100 | #34 | Exceptional 53.3% |
| Russians | 100.0 /100 | #35 | Exceptional 53.2% |
| Immigrants | Russia | 100.0 /100 | #36 | Exceptional 53.1% |
| Immigrants | Denmark | 100.0 /100 | #37 | Exceptional 53.1% |
| Mongolians | 100.0 /100 | #38 | Exceptional 53.0% |
| Immigrants | Belarus | 99.9 /100 | #39 | Exceptional 52.8% |
| Immigrants | Latvia | 99.9 /100 | #40 | Exceptional 52.8% |
| Immigrants | Saudi Arabia | 99.9 /100 | #41 | Exceptional 52.6% |
| Immigrants | Malaysia | 99.9 /100 | #42 | Exceptional 52.5% |
| Immigrants | South Africa | 99.9 /100 | #43 | Exceptional 52.5% |
| Estonians | 99.9 /100 | #44 | Exceptional 52.5% |
Demographics Similar to Nigerians by Associate's Degree
In terms of associate's degree, the demographic groups most similar to Nigerians are Immigrants from Thailand (45.1%, a difference of 0.020%), German Russian (45.1%, a difference of 0.030%), Panamanian (45.1%, a difference of 0.090%), Immigrants from South Eastern Asia (45.2%, a difference of 0.14%), and Spaniard (45.2%, a difference of 0.16%).
| Demographics | Rating | Rank | Associate's Degree |
| Scotch-Irish | 22.3 /100 | #197 | Fair 45.3% |
| Immigrants | Bangladesh | 21.3 /100 | #198 | Fair 45.2% |
| Immigrants | Senegal | 21.2 /100 | #199 | Fair 45.2% |
| Senegalese | 21.1 /100 | #200 | Fair 45.2% |
| Immigrants | Vietnam | 20.8 /100 | #201 | Fair 45.2% |
| Spaniards | 20.4 /100 | #202 | Fair 45.2% |
| Immigrants | South Eastern Asia | 20.2 /100 | #203 | Fair 45.2% |
| Nigerians | 19.1 /100 | #204 | Poor 45.1% |
| Immigrants | Thailand | 18.9 /100 | #205 | Poor 45.1% |
| German Russians | 18.9 /100 | #206 | Poor 45.1% |
| Panamanians | 18.4 /100 | #207 | Poor 45.1% |
| Dutch | 17.6 /100 | #208 | Poor 45.0% |
| Immigrants | Costa Rica | 16.7 /100 | #209 | Poor 45.0% |
| Immigrants | Philippines | 16.7 /100 | #210 | Poor 45.0% |
| Immigrants | Zaire | 16.6 /100 | #211 | Poor 45.0% |