Immigrants from Denmark vs Nigerian In Labor Force | Age 20-64
COMPARE
Immigrants from Denmark
Nigerian
In Labor Force | Age 20-64
In Labor Force | Age 20-64 Comparison
Immigrants from Denmark
Nigerians
79.4%
IN LABOR FORCE | AGE 20-64
26.9/ 100
METRIC RATING
192nd/ 347
METRIC RANK
79.7%
IN LABOR FORCE | AGE 20-64
64.0/ 100
METRIC RATING
165th/ 347
METRIC RANK
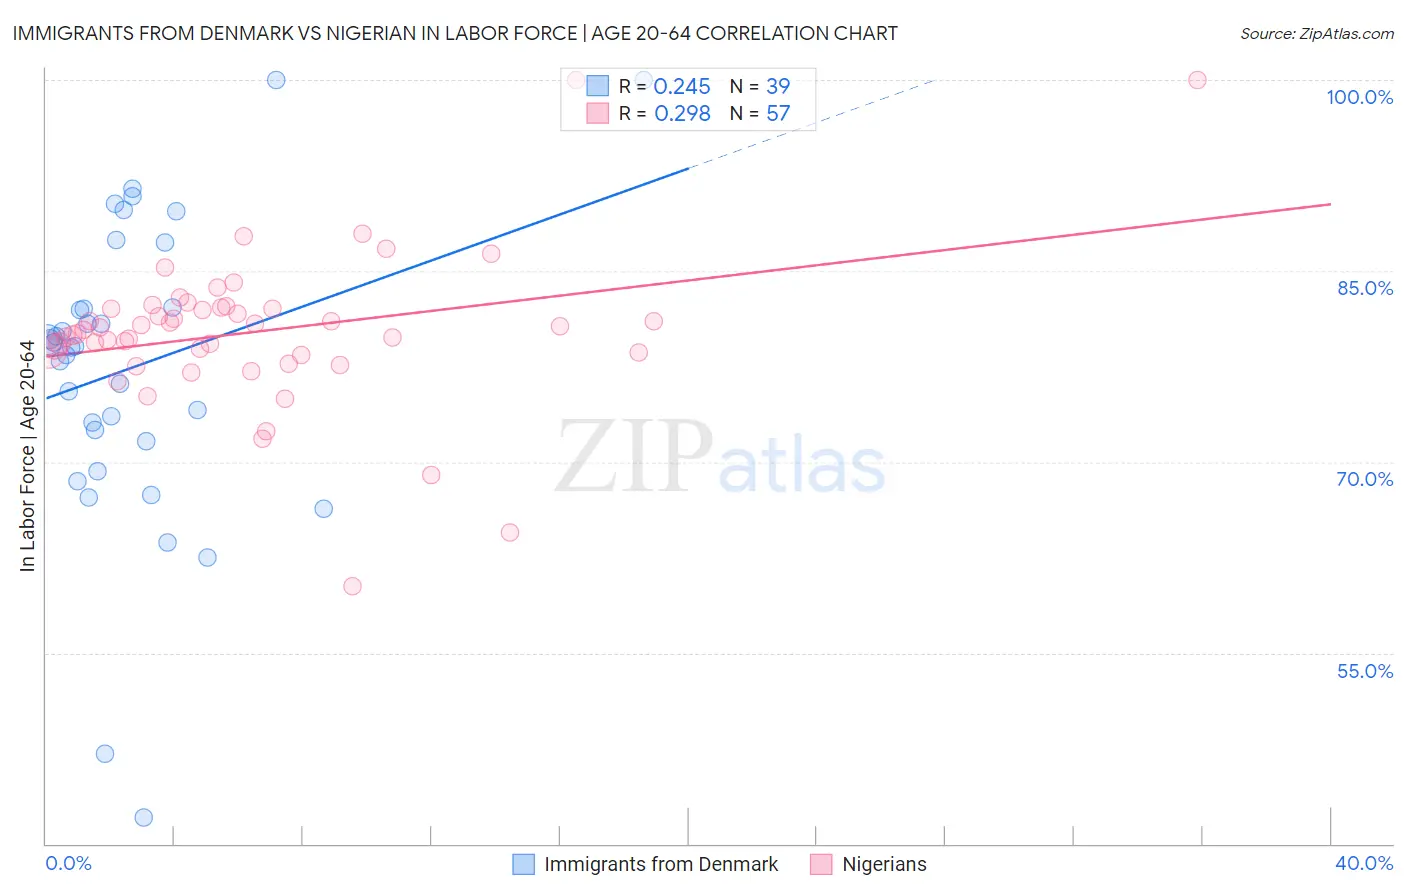
Immigrants from Denmark vs Nigerian In Labor Force | Age 20-64 Correlation Chart
The statistical analysis conducted on geographies consisting of 136,432,253 people shows a weak positive correlation between the proportion of Immigrants from Denmark and labor force participation rate among population between the ages 20 and 64 in the United States with a correlation coefficient (R) of 0.245 and weighted average of 79.4%. Similarly, the statistical analysis conducted on geographies consisting of 332,789,973 people shows a weak positive correlation between the proportion of Nigerians and labor force participation rate among population between the ages 20 and 64 in the United States with a correlation coefficient (R) of 0.298 and weighted average of 79.7%, a difference of 0.32%.
In Labor Force | Age 20-64 Correlation Summary
| Measurement | Immigrants from Denmark | Nigerian |
| Minimum | 42.1% | 60.2% |
| Maximum | 100.0% | 100.0% |
| Range | 57.9% | 39.8% |
| Mean | 77.4% | 80.2% |
| Median | 79.1% | 80.4% |
| Interquartile 25% (IQ1) | 71.6% | 78.5% |
| Interquartile 75% (IQ3) | 82.1% | 82.1% |
| Interquartile Range (IQR) | 10.5% | 3.6% |
| Standard Deviation (Sample) | 11.9% | 6.1% |
| Standard Deviation (Population) | 11.7% | 6.1% |
Similar Demographics by In Labor Force | Age 20-64
Demographics Similar to Immigrants from Denmark by In Labor Force | Age 20-64
In terms of in labor force | age 20-64, the demographic groups most similar to Immigrants from Denmark are Indonesian (79.4%, a difference of 0.010%), Swiss (79.4%, a difference of 0.020%), Immigrants from Thailand (79.4%, a difference of 0.020%), Immigrants from Austria (79.4%, a difference of 0.030%), and Immigrants from El Salvador (79.4%, a difference of 0.040%).
| Demographics | Rating | Rank | In Labor Force | Age 20-64 |
| Israelis | 34.7 /100 | #185 | Fair 79.5% |
| Northern Europeans | 34.5 /100 | #186 | Fair 79.5% |
| Assyrians/Chaldeans/Syriacs | 33.3 /100 | #187 | Fair 79.4% |
| Immigrants | Haiti | 32.1 /100 | #188 | Fair 79.4% |
| Immigrants | El Salvador | 30.9 /100 | #189 | Fair 79.4% |
| Immigrants | Syria | 30.8 /100 | #190 | Fair 79.4% |
| Swiss | 28.9 /100 | #191 | Fair 79.4% |
| Immigrants | Denmark | 26.9 /100 | #192 | Fair 79.4% |
| Indonesians | 26.1 /100 | #193 | Fair 79.4% |
| Immigrants | Thailand | 24.8 /100 | #194 | Fair 79.4% |
| Immigrants | Austria | 23.7 /100 | #195 | Fair 79.4% |
| Ecuadorians | 23.1 /100 | #196 | Fair 79.4% |
| Immigrants | Senegal | 22.5 /100 | #197 | Fair 79.4% |
| Immigrants | Laos | 21.5 /100 | #198 | Fair 79.4% |
| Dutch | 20.2 /100 | #199 | Fair 79.3% |
Demographics Similar to Nigerians by In Labor Force | Age 20-64
In terms of in labor force | age 20-64, the demographic groups most similar to Nigerians are Immigrants from Costa Rica (79.7%, a difference of 0.0%), Immigrants from Burma/Myanmar (79.7%, a difference of 0.0%), German (79.7%, a difference of 0.010%), Okinawan (79.6%, a difference of 0.010%), and Immigrants from Cuba (79.7%, a difference of 0.020%).
| Demographics | Rating | Rank | In Labor Force | Age 20-64 |
| Austrians | 67.6 /100 | #158 | Good 79.7% |
| Immigrants | Cuba | 66.7 /100 | #159 | Good 79.7% |
| Moroccans | 66.7 /100 | #160 | Good 79.7% |
| South Africans | 66.2 /100 | #161 | Good 79.7% |
| Germans | 65.2 /100 | #162 | Good 79.7% |
| Immigrants | Costa Rica | 64.6 /100 | #163 | Good 79.7% |
| Immigrants | Burma/Myanmar | 64.4 /100 | #164 | Good 79.7% |
| Nigerians | 64.0 /100 | #165 | Good 79.7% |
| Okinawans | 62.7 /100 | #166 | Good 79.6% |
| Immigrants | Iraq | 62.0 /100 | #167 | Good 79.6% |
| Immigrants | Indonesia | 61.8 /100 | #168 | Good 79.6% |
| Laotians | 58.4 /100 | #169 | Average 79.6% |
| Slavs | 54.0 /100 | #170 | Average 79.6% |
| Immigrants | Switzerland | 53.3 /100 | #171 | Average 79.6% |
| Immigrants | Belgium | 53.1 /100 | #172 | Average 79.6% |