Immigrants from Denmark vs Immigrants from Uganda Disability
COMPARE
Immigrants from Denmark
Immigrants from Uganda
Disability
Disability Comparison
Immigrants from Denmark
Immigrants from Uganda
11.3%
DISABILITY
95.6/ 100
METRIC RATING
110th/ 347
METRIC RANK
11.3%
DISABILITY
95.7/ 100
METRIC RATING
109th/ 347
METRIC RANK
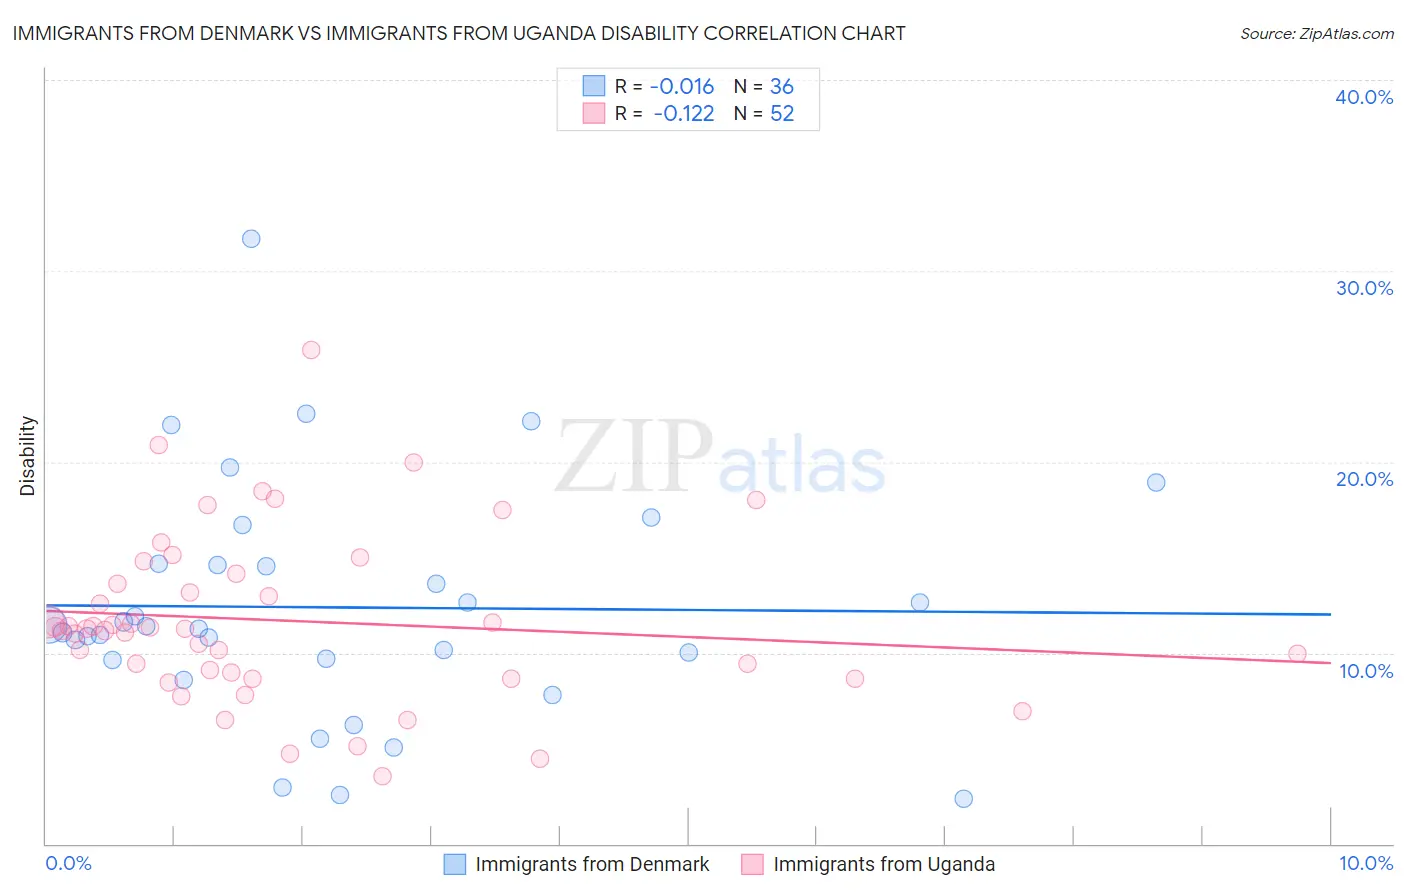
Immigrants from Denmark vs Immigrants from Uganda Disability Correlation Chart
The statistical analysis conducted on geographies consisting of 136,432,465 people shows no correlation between the proportion of Immigrants from Denmark and percentage of population with a disability in the United States with a correlation coefficient (R) of -0.016 and weighted average of 11.3%. Similarly, the statistical analysis conducted on geographies consisting of 125,981,344 people shows a poor negative correlation between the proportion of Immigrants from Uganda and percentage of population with a disability in the United States with a correlation coefficient (R) of -0.122 and weighted average of 11.3%, a difference of 0.020%.
Disability Correlation Summary
| Measurement | Immigrants from Denmark | Immigrants from Uganda |
| Minimum | 2.4% | 3.5% |
| Maximum | 31.7% | 25.9% |
| Range | 29.3% | 22.4% |
| Mean | 12.4% | 11.7% |
| Median | 11.3% | 11.3% |
| Interquartile 25% (IQ1) | 9.6% | 8.8% |
| Interquartile 75% (IQ3) | 14.7% | 13.9% |
| Interquartile Range (IQR) | 5.0% | 5.1% |
| Standard Deviation (Sample) | 6.1% | 4.4% |
| Standard Deviation (Population) | 6.0% | 4.4% |
Demographics Similar to Immigrants from Denmark and Immigrants from Uganda by Disability
In terms of disability, the demographic groups most similar to Immigrants from Denmark are Immigrants from South Eastern Asia (11.3%, a difference of 0.070%), Immigrants from Nigeria (11.3%, a difference of 0.10%), Nicaraguan (11.3%, a difference of 0.18%), Immigrants from Uzbekistan (11.3%, a difference of 0.18%), and Immigrants from Eastern Europe (11.3%, a difference of 0.20%). Similarly, the demographic groups most similar to Immigrants from Uganda are Immigrants from Nigeria (11.3%, a difference of 0.080%), Immigrants from South Eastern Asia (11.3%, a difference of 0.080%), Nicaraguan (11.3%, a difference of 0.16%), Immigrants from Eastern Europe (11.3%, a difference of 0.18%), and Immigrants from Uzbekistan (11.3%, a difference of 0.20%).
| Demographics | Rating | Rank | Disability |
| Immigrants | Czechoslovakia | 97.4 /100 | #99 | Exceptional 11.2% |
| Immigrants | Greece | 96.9 /100 | #100 | Exceptional 11.3% |
| Immigrants | Nicaragua | 96.8 /100 | #101 | Exceptional 11.3% |
| Immigrants | Eastern Africa | 96.7 /100 | #102 | Exceptional 11.3% |
| Immigrants | Uruguay | 96.4 /100 | #103 | Exceptional 11.3% |
| Immigrants | Immigrants | 96.4 /100 | #104 | Exceptional 11.3% |
| Immigrants | Kazakhstan | 96.4 /100 | #105 | Exceptional 11.3% |
| Immigrants | Eastern Europe | 96.3 /100 | #106 | Exceptional 11.3% |
| Nicaraguans | 96.2 /100 | #107 | Exceptional 11.3% |
| Immigrants | Nigeria | 96.0 /100 | #108 | Exceptional 11.3% |
| Immigrants | Uganda | 95.7 /100 | #109 | Exceptional 11.3% |
| Immigrants | Denmark | 95.6 /100 | #110 | Exceptional 11.3% |
| Immigrants | South Eastern Asia | 95.4 /100 | #111 | Exceptional 11.3% |
| Immigrants | Uzbekistan | 94.9 /100 | #112 | Exceptional 11.3% |
| Guyanese | 94.7 /100 | #113 | Exceptional 11.3% |
| Immigrants | Syria | 94.7 /100 | #114 | Exceptional 11.3% |
| Immigrants | Philippines | 94.6 /100 | #115 | Exceptional 11.3% |
| Immigrants | Northern Europe | 94.1 /100 | #116 | Exceptional 11.3% |
| Luxembourgers | 93.9 /100 | #117 | Exceptional 11.3% |
| Koreans | 93.8 /100 | #118 | Exceptional 11.3% |
| Central Americans | 93.5 /100 | #119 | Exceptional 11.4% |