Immigrants from Middle Africa vs Spanish Disability Age 5 to 17
COMPARE
Immigrants from Middle Africa
Spanish
Disability Age 5 to 17
Disability Age 5 to 17 Comparison
Immigrants from Middle Africa
Spanish
5.9%
DISABILITY AGE 5 TO 17
0.7/ 100
METRIC RATING
261st/ 347
METRIC RANK
6.0%
DISABILITY AGE 5 TO 17
0.5/ 100
METRIC RATING
267th/ 347
METRIC RANK
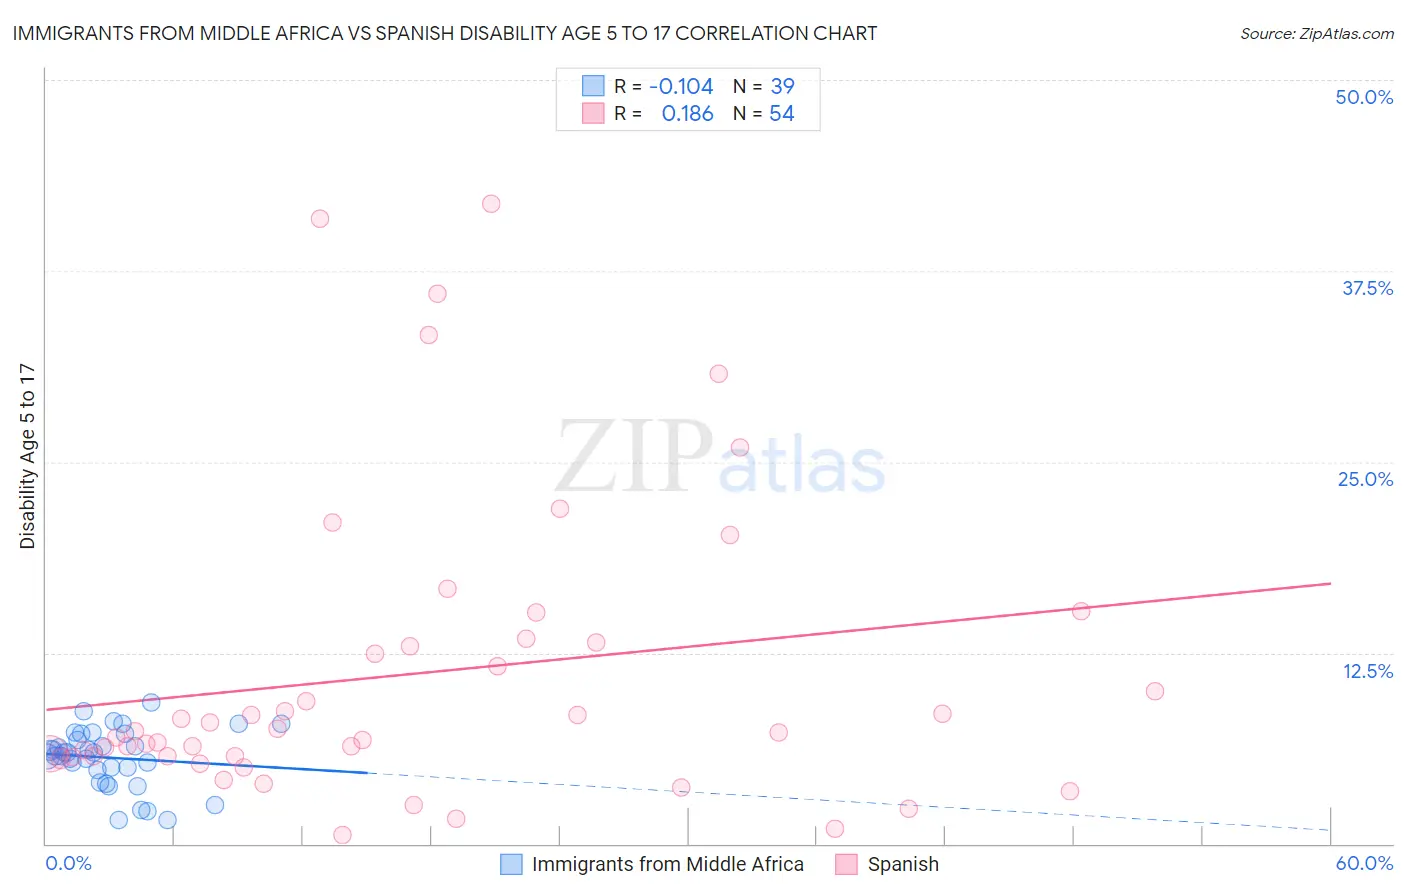
Immigrants from Middle Africa vs Spanish Disability Age 5 to 17 Correlation Chart
The statistical analysis conducted on geographies consisting of 202,029,943 people shows a poor negative correlation between the proportion of Immigrants from Middle Africa and percentage of population with a disability between the ages 5 and 17 in the United States with a correlation coefficient (R) of -0.104 and weighted average of 5.9%. Similarly, the statistical analysis conducted on geographies consisting of 418,244,761 people shows a poor positive correlation between the proportion of Spanish and percentage of population with a disability between the ages 5 and 17 in the United States with a correlation coefficient (R) of 0.186 and weighted average of 6.0%, a difference of 0.44%.
Disability Age 5 to 17 Correlation Summary
| Measurement | Immigrants from Middle Africa | Spanish |
| Minimum | 1.5% | 0.61% |
| Maximum | 9.2% | 41.9% |
| Range | 7.7% | 41.3% |
| Mean | 5.6% | 11.1% |
| Median | 6.0% | 7.3% |
| Interquartile 25% (IQ1) | 4.8% | 5.7% |
| Interquartile 75% (IQ3) | 7.2% | 13.2% |
| Interquartile Range (IQR) | 2.4% | 7.5% |
| Standard Deviation (Sample) | 1.9% | 9.8% |
| Standard Deviation (Population) | 1.9% | 9.8% |
Demographics Similar to Immigrants from Middle Africa and Spanish by Disability Age 5 to 17
In terms of disability age 5 to 17, the demographic groups most similar to Immigrants from Middle Africa are Immigrants from Western Africa (5.9%, a difference of 0.030%), Somali (5.9%, a difference of 0.070%), Czechoslovakian (5.9%, a difference of 0.11%), Slavic (5.9%, a difference of 0.20%), and Canadian (6.0%, a difference of 0.23%). Similarly, the demographic groups most similar to Spanish are Slovene (6.0%, a difference of 0.11%), Panamanian (6.0%, a difference of 0.13%), Sioux (6.0%, a difference of 0.19%), Canadian (6.0%, a difference of 0.21%), and Liberian (6.0%, a difference of 0.22%).
| Demographics | Rating | Rank | Disability Age 5 to 17 |
| Barbadians | 1.3 /100 | #254 | Tragic 5.9% |
| Italians | 1.2 /100 | #255 | Tragic 5.9% |
| Hopi | 1.0 /100 | #256 | Tragic 5.9% |
| Hispanics or Latinos | 1.0 /100 | #257 | Tragic 5.9% |
| Brazilians | 0.9 /100 | #258 | Tragic 5.9% |
| Slavs | 0.9 /100 | #259 | Tragic 5.9% |
| Somalis | 0.8 /100 | #260 | Tragic 5.9% |
| Immigrants | Middle Africa | 0.7 /100 | #261 | Tragic 5.9% |
| Immigrants | Western Africa | 0.7 /100 | #262 | Tragic 5.9% |
| Czechoslovakians | 0.7 /100 | #263 | Tragic 5.9% |
| Canadians | 0.6 /100 | #264 | Tragic 6.0% |
| Panamanians | 0.6 /100 | #265 | Tragic 6.0% |
| Slovenes | 0.6 /100 | #266 | Tragic 6.0% |
| Spanish | 0.5 /100 | #267 | Tragic 6.0% |
| Sioux | 0.4 /100 | #268 | Tragic 6.0% |
| Liberians | 0.4 /100 | #269 | Tragic 6.0% |
| Immigrants | Somalia | 0.4 /100 | #270 | Tragic 6.0% |
| Immigrants | Zaire | 0.2 /100 | #271 | Tragic 6.0% |
| Finns | 0.2 /100 | #272 | Tragic 6.0% |
| Alaska Natives | 0.2 /100 | #273 | Tragic 6.0% |
| Cheyenne | 0.2 /100 | #274 | Tragic 6.0% |