Immigrants from Congo vs Nicaraguan Male Poverty
COMPARE
Immigrants from Congo
Nicaraguan
Male Poverty
Male Poverty Comparison
Immigrants from Congo
Nicaraguans
14.7%
MALE POVERTY
0.0/ 100
METRIC RATING
320th/ 347
METRIC RANK
12.6%
MALE POVERTY
0.6/ 100
METRIC RATING
232nd/ 347
METRIC RANK
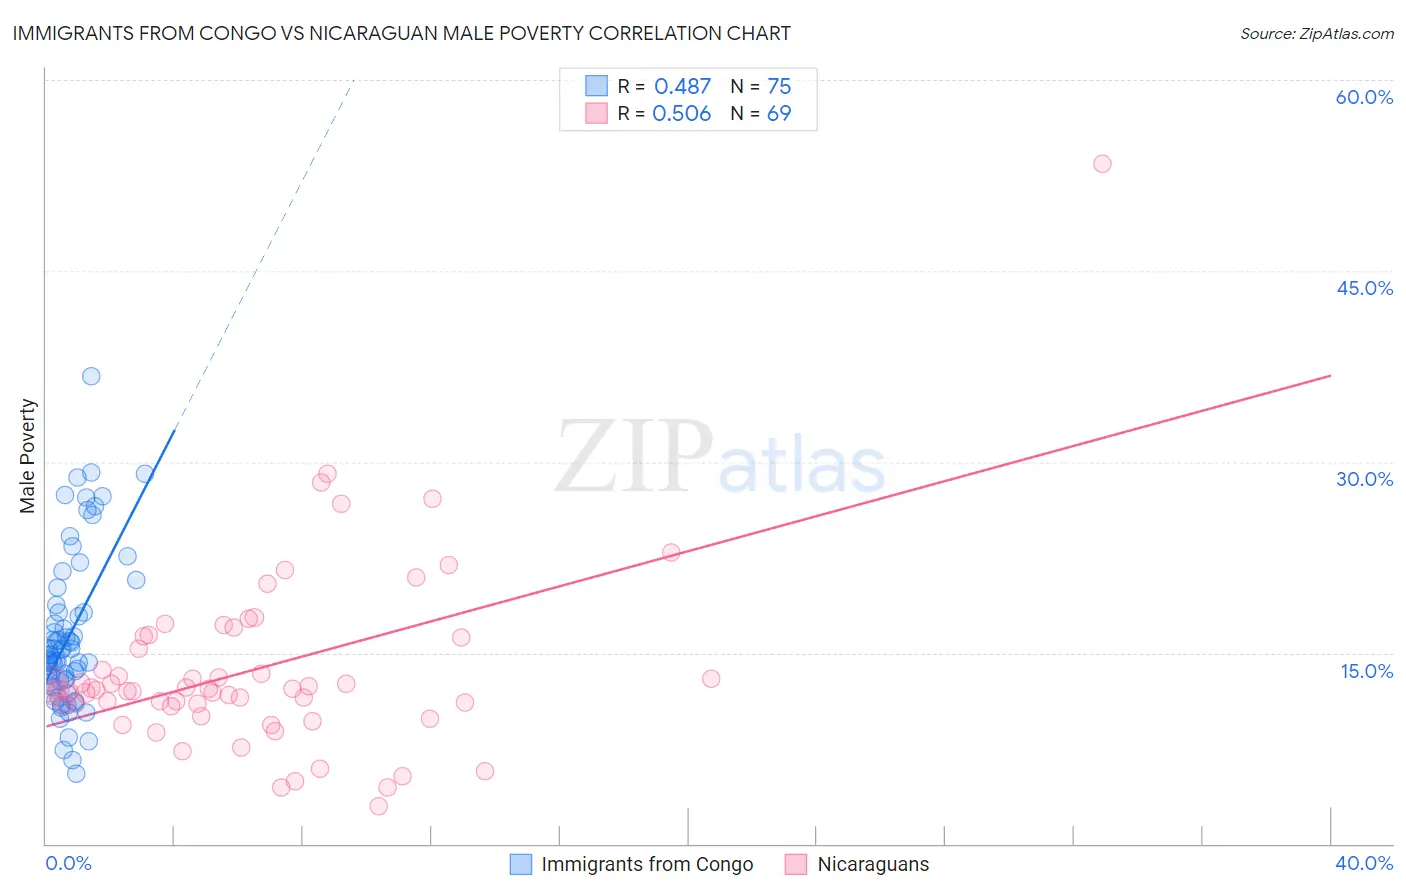
Immigrants from Congo vs Nicaraguan Male Poverty Correlation Chart
The statistical analysis conducted on geographies consisting of 92,079,849 people shows a moderate positive correlation between the proportion of Immigrants from Congo and poverty level among males in the United States with a correlation coefficient (R) of 0.487 and weighted average of 14.7%. Similarly, the statistical analysis conducted on geographies consisting of 285,585,810 people shows a substantial positive correlation between the proportion of Nicaraguans and poverty level among males in the United States with a correlation coefficient (R) of 0.506 and weighted average of 12.6%, a difference of 17.0%.
Male Poverty Correlation Summary
| Measurement | Immigrants from Congo | Nicaraguan |
| Minimum | 5.5% | 2.9% |
| Maximum | 36.7% | 53.4% |
| Range | 31.2% | 50.5% |
| Mean | 16.3% | 13.7% |
| Median | 14.8% | 12.1% |
| Interquartile 25% (IQ1) | 12.7% | 10.9% |
| Interquartile 75% (IQ3) | 18.1% | 16.3% |
| Interquartile Range (IQR) | 5.4% | 5.4% |
| Standard Deviation (Sample) | 6.1% | 7.3% |
| Standard Deviation (Population) | 6.0% | 7.3% |
Similar Demographics by Male Poverty
Demographics Similar to Immigrants from Congo by Male Poverty
In terms of male poverty, the demographic groups most similar to Immigrants from Congo are U.S. Virgin Islander (14.7%, a difference of 0.090%), Immigrants from Grenada (14.7%, a difference of 0.12%), Immigrants from Dominica (14.7%, a difference of 0.18%), British West Indian (14.6%, a difference of 0.86%), and Chippewa (14.6%, a difference of 0.88%).
| Demographics | Rating | Rank | Male Poverty |
| Immigrants | Somalia | 0.0 /100 | #313 | Tragic 14.6% |
| Immigrants | Honduras | 0.0 /100 | #314 | Tragic 14.6% |
| Chippewa | 0.0 /100 | #315 | Tragic 14.6% |
| British West Indians | 0.0 /100 | #316 | Tragic 14.6% |
| Immigrants | Dominica | 0.0 /100 | #317 | Tragic 14.7% |
| Immigrants | Grenada | 0.0 /100 | #318 | Tragic 14.7% |
| U.S. Virgin Islanders | 0.0 /100 | #319 | Tragic 14.7% |
| Immigrants | Congo | 0.0 /100 | #320 | Tragic 14.7% |
| Arapaho | 0.0 /100 | #321 | Tragic 15.1% |
| Kiowa | 0.0 /100 | #322 | Tragic 15.2% |
| Colville | 0.0 /100 | #323 | Tragic 15.2% |
| Menominee | 0.0 /100 | #324 | Tragic 15.3% |
| Yakama | 0.0 /100 | #325 | Tragic 15.3% |
| Central American Indians | 0.0 /100 | #326 | Tragic 15.3% |
| Paiute | 0.0 /100 | #327 | Tragic 15.8% |
Demographics Similar to Nicaraguans by Male Poverty
In terms of male poverty, the demographic groups most similar to Nicaraguans are Fijian (12.6%, a difference of 0.050%), Immigrants from Armenia (12.6%, a difference of 0.11%), Salvadoran (12.6%, a difference of 0.12%), Immigrants from Laos (12.6%, a difference of 0.47%), and Marshallese (12.5%, a difference of 0.68%).
| Demographics | Rating | Rank | Male Poverty |
| Osage | 1.5 /100 | #225 | Tragic 12.3% |
| Nigerians | 1.4 /100 | #226 | Tragic 12.3% |
| Alaska Natives | 1.4 /100 | #227 | Tragic 12.4% |
| Alsatians | 1.3 /100 | #228 | Tragic 12.4% |
| Cubans | 1.3 /100 | #229 | Tragic 12.4% |
| Marshallese | 0.8 /100 | #230 | Tragic 12.5% |
| Salvadorans | 0.6 /100 | #231 | Tragic 12.6% |
| Nicaraguans | 0.6 /100 | #232 | Tragic 12.6% |
| Fijians | 0.6 /100 | #233 | Tragic 12.6% |
| Immigrants | Armenia | 0.6 /100 | #234 | Tragic 12.6% |
| Immigrants | Laos | 0.5 /100 | #235 | Tragic 12.6% |
| Immigrants | Saudi Arabia | 0.4 /100 | #236 | Tragic 12.7% |
| French American Indians | 0.4 /100 | #237 | Tragic 12.7% |
| Ecuadorians | 0.4 /100 | #238 | Tragic 12.7% |
| Ghanaians | 0.4 /100 | #239 | Tragic 12.7% |