Immigrants from Congo vs Nicaraguan In Labor Force | Age 35-44
COMPARE
Immigrants from Congo
Nicaraguan
In Labor Force | Age 35-44
In Labor Force | Age 35-44 Comparison
Immigrants from Congo
Nicaraguans
83.5%
IN LABOR FORCE | AGE 35-44
0.2/ 100
METRIC RATING
262nd/ 347
METRIC RANK
84.1%
IN LABOR FORCE | AGE 35-44
12.1/ 100
METRIC RATING
216th/ 347
METRIC RANK
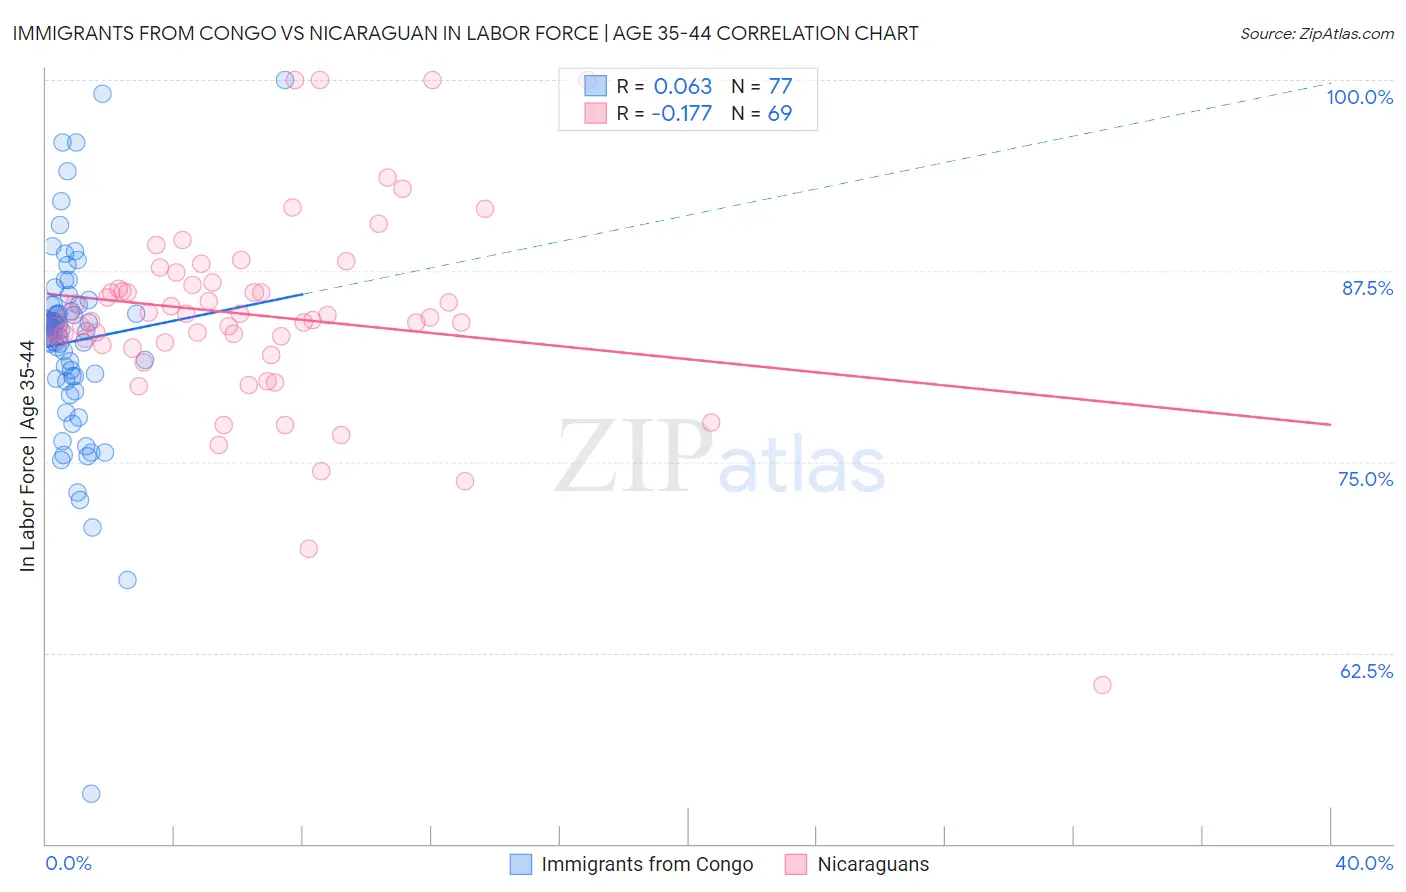
Immigrants from Congo vs Nicaraguan In Labor Force | Age 35-44 Correlation Chart
The statistical analysis conducted on geographies consisting of 92,106,989 people shows a slight positive correlation between the proportion of Immigrants from Congo and labor force participation rate among population between the ages 35 and 44 in the United States with a correlation coefficient (R) of 0.063 and weighted average of 83.5%. Similarly, the statistical analysis conducted on geographies consisting of 285,645,382 people shows a poor negative correlation between the proportion of Nicaraguans and labor force participation rate among population between the ages 35 and 44 in the United States with a correlation coefficient (R) of -0.177 and weighted average of 84.1%, a difference of 0.70%.
In Labor Force | Age 35-44 Correlation Summary
| Measurement | Immigrants from Congo | Nicaraguan |
| Minimum | 53.3% | 60.4% |
| Maximum | 100.0% | 100.0% |
| Range | 46.7% | 39.6% |
| Mean | 82.9% | 84.6% |
| Median | 83.6% | 84.4% |
| Interquartile 25% (IQ1) | 80.5% | 82.7% |
| Interquartile 75% (IQ3) | 85.3% | 86.7% |
| Interquartile Range (IQR) | 4.7% | 3.9% |
| Standard Deviation (Sample) | 6.7% | 6.4% |
| Standard Deviation (Population) | 6.7% | 6.4% |
Similar Demographics by In Labor Force | Age 35-44
Demographics Similar to Immigrants from Congo by In Labor Force | Age 35-44
In terms of in labor force | age 35-44, the demographic groups most similar to Immigrants from Congo are Vietnamese (83.5%, a difference of 0.010%), Immigrants from Dominica (83.5%, a difference of 0.010%), Immigrants from El Salvador (83.5%, a difference of 0.020%), Iroquois (83.5%, a difference of 0.030%), and Tsimshian (83.5%, a difference of 0.040%).
| Demographics | Rating | Rank | In Labor Force | Age 35-44 |
| Immigrants | Azores | 0.3 /100 | #255 | Tragic 83.6% |
| Japanese | 0.3 /100 | #256 | Tragic 83.6% |
| Basques | 0.3 /100 | #257 | Tragic 83.6% |
| Tsimshian | 0.2 /100 | #258 | Tragic 83.5% |
| Immigrants | El Salvador | 0.2 /100 | #259 | Tragic 83.5% |
| Vietnamese | 0.2 /100 | #260 | Tragic 83.5% |
| Immigrants | Dominica | 0.2 /100 | #261 | Tragic 83.5% |
| Immigrants | Congo | 0.2 /100 | #262 | Tragic 83.5% |
| Iroquois | 0.2 /100 | #263 | Tragic 83.5% |
| Scotch-Irish | 0.1 /100 | #264 | Tragic 83.5% |
| Central Americans | 0.1 /100 | #265 | Tragic 83.5% |
| Spaniards | 0.1 /100 | #266 | Tragic 83.4% |
| Guamanians/Chamorros | 0.1 /100 | #267 | Tragic 83.4% |
| Hondurans | 0.1 /100 | #268 | Tragic 83.4% |
| Immigrants | Grenada | 0.1 /100 | #269 | Tragic 83.3% |
Demographics Similar to Nicaraguans by In Labor Force | Age 35-44
In terms of in labor force | age 35-44, the demographic groups most similar to Nicaraguans are European (84.1%, a difference of 0.0%), Immigrants from Norway (84.1%, a difference of 0.010%), Bangladeshi (84.1%, a difference of 0.020%), Immigrants from Barbados (84.1%, a difference of 0.020%), and Israeli (84.1%, a difference of 0.030%).
| Demographics | Rating | Rank | In Labor Force | Age 35-44 |
| Swiss | 17.4 /100 | #209 | Poor 84.2% |
| New Zealanders | 16.2 /100 | #210 | Poor 84.1% |
| Immigrants | Ecuador | 15.2 /100 | #211 | Poor 84.1% |
| Israelis | 14.0 /100 | #212 | Poor 84.1% |
| Bangladeshis | 13.7 /100 | #213 | Poor 84.1% |
| Immigrants | Barbados | 13.2 /100 | #214 | Poor 84.1% |
| Europeans | 12.2 /100 | #215 | Poor 84.1% |
| Nicaraguans | 12.1 /100 | #216 | Poor 84.1% |
| Immigrants | Norway | 11.7 /100 | #217 | Poor 84.1% |
| Immigrants | Nicaragua | 9.4 /100 | #218 | Tragic 84.1% |
| Sub-Saharan Africans | 9.3 /100 | #219 | Tragic 84.1% |
| French | 7.5 /100 | #220 | Tragic 84.0% |
| Icelanders | 6.7 /100 | #221 | Tragic 84.0% |
| Assyrians/Chaldeans/Syriacs | 6.6 /100 | #222 | Tragic 84.0% |
| Immigrants | Panama | 6.4 /100 | #223 | Tragic 84.0% |