Immigrants from Congo vs Immigrants from Ecuador 2nd Grade
COMPARE
Immigrants from Congo
Immigrants from Ecuador
2nd Grade
2nd Grade Comparison
Immigrants from Congo
Immigrants from Ecuador
97.5%
2ND GRADE
0.6/ 100
METRIC RATING
255th/ 347
METRIC RANK
96.8%
2ND GRADE
0.0/ 100
METRIC RATING
314th/ 347
METRIC RANK
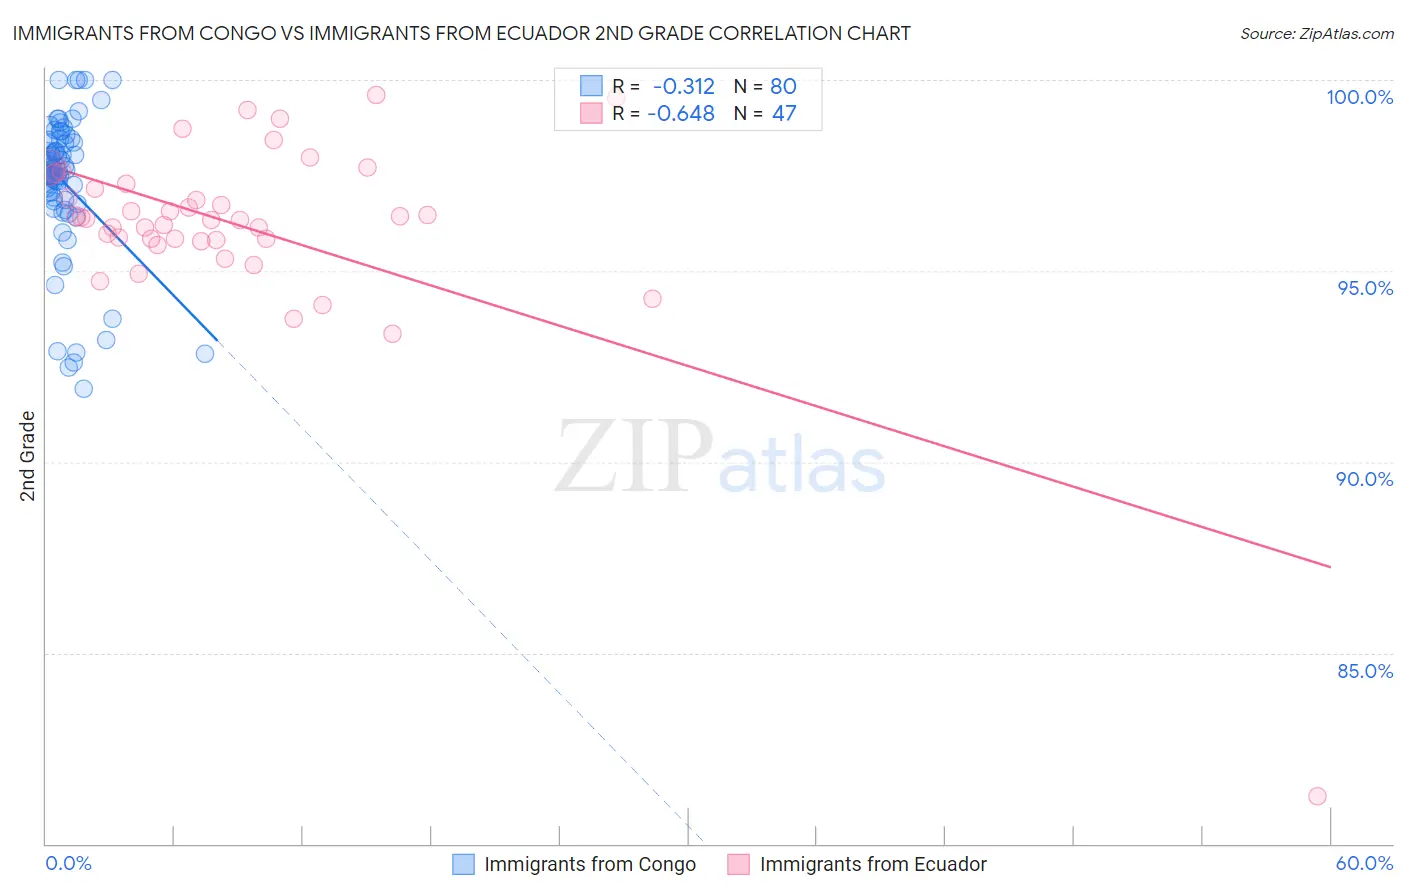
Immigrants from Congo vs Immigrants from Ecuador 2nd Grade Correlation Chart
The statistical analysis conducted on geographies consisting of 92,124,753 people shows a mild negative correlation between the proportion of Immigrants from Congo and percentage of population with at least 2nd grade education in the United States with a correlation coefficient (R) of -0.312 and weighted average of 97.5%. Similarly, the statistical analysis conducted on geographies consisting of 271,020,679 people shows a significant negative correlation between the proportion of Immigrants from Ecuador and percentage of population with at least 2nd grade education in the United States with a correlation coefficient (R) of -0.648 and weighted average of 96.8%, a difference of 0.72%.
2nd Grade Correlation Summary
| Measurement | Immigrants from Congo | Immigrants from Ecuador |
| Minimum | 91.9% | 81.2% |
| Maximum | 100.0% | 99.6% |
| Range | 8.1% | 18.3% |
| Mean | 97.3% | 96.2% |
| Median | 97.6% | 96.4% |
| Interquartile 25% (IQ1) | 96.8% | 95.8% |
| Interquartile 75% (IQ3) | 98.4% | 97.3% |
| Interquartile Range (IQR) | 1.5% | 1.5% |
| Standard Deviation (Sample) | 1.8% | 2.6% |
| Standard Deviation (Population) | 1.8% | 2.6% |
Similar Demographics by 2nd Grade
Demographics Similar to Immigrants from Congo by 2nd Grade
In terms of 2nd grade, the demographic groups most similar to Immigrants from Congo are Indian (Asian) (97.5%, a difference of 0.0%), Jamaican (97.5%, a difference of 0.0%), Puerto Rican (97.5%, a difference of 0.010%), Immigrants from Colombia (97.5%, a difference of 0.010%), and Yaqui (97.5%, a difference of 0.010%).
| Demographics | Rating | Rank | 2nd Grade |
| Immigrants | Middle Africa | 0.9 /100 | #248 | Tragic 97.5% |
| Bolivians | 0.9 /100 | #249 | Tragic 97.5% |
| Peruvians | 0.9 /100 | #250 | Tragic 97.5% |
| Immigrants | Africa | 0.8 /100 | #251 | Tragic 97.5% |
| Immigrants | Asia | 0.7 /100 | #252 | Tragic 97.5% |
| Puerto Ricans | 0.7 /100 | #253 | Tragic 97.5% |
| Indians (Asian) | 0.6 /100 | #254 | Tragic 97.5% |
| Immigrants | Congo | 0.6 /100 | #255 | Tragic 97.5% |
| Jamaicans | 0.6 /100 | #256 | Tragic 97.5% |
| Immigrants | Colombia | 0.5 /100 | #257 | Tragic 97.5% |
| Yaqui | 0.5 /100 | #258 | Tragic 97.5% |
| Fijians | 0.5 /100 | #259 | Tragic 97.5% |
| Assyrians/Chaldeans/Syriacs | 0.5 /100 | #260 | Tragic 97.5% |
| Armenians | 0.5 /100 | #261 | Tragic 97.5% |
| Taiwanese | 0.4 /100 | #262 | Tragic 97.4% |
Demographics Similar to Immigrants from Ecuador by 2nd Grade
In terms of 2nd grade, the demographic groups most similar to Immigrants from Ecuador are Immigrants from Belize (96.8%, a difference of 0.020%), Hispanic or Latino (96.8%, a difference of 0.030%), Honduran (96.7%, a difference of 0.030%), Immigrants from Laos (96.7%, a difference of 0.030%), and Indonesian (96.7%, a difference of 0.030%).
| Demographics | Rating | Rank | 2nd Grade |
| Immigrants | Azores | 0.0 /100 | #307 | Tragic 96.8% |
| Immigrants | Haiti | 0.0 /100 | #308 | Tragic 96.8% |
| Belizeans | 0.0 /100 | #309 | Tragic 96.8% |
| Sri Lankans | 0.0 /100 | #310 | Tragic 96.8% |
| Guyanese | 0.0 /100 | #311 | Tragic 96.8% |
| Cape Verdeans | 0.0 /100 | #312 | Tragic 96.8% |
| Hispanics or Latinos | 0.0 /100 | #313 | Tragic 96.8% |
| Immigrants | Ecuador | 0.0 /100 | #314 | Tragic 96.8% |
| Immigrants | Belize | 0.0 /100 | #315 | Tragic 96.8% |
| Hondurans | 0.0 /100 | #316 | Tragic 96.7% |
| Immigrants | Laos | 0.0 /100 | #317 | Tragic 96.7% |
| Indonesians | 0.0 /100 | #318 | Tragic 96.7% |
| Immigrants | Nicaragua | 0.0 /100 | #319 | Tragic 96.7% |
| Immigrants | Guyana | 0.0 /100 | #320 | Tragic 96.7% |
| Immigrants | Burma/Myanmar | 0.0 /100 | #321 | Tragic 96.7% |