Immigrants from Congo vs Cheyenne Male Disability
COMPARE
Immigrants from Congo
Cheyenne
Male Disability
Male Disability Comparison
Immigrants from Congo
Cheyenne
11.7%
MALE DISABILITY
3.7/ 100
METRIC RATING
221st/ 347
METRIC RANK
13.0%
MALE DISABILITY
0.0/ 100
METRIC RATING
300th/ 347
METRIC RANK
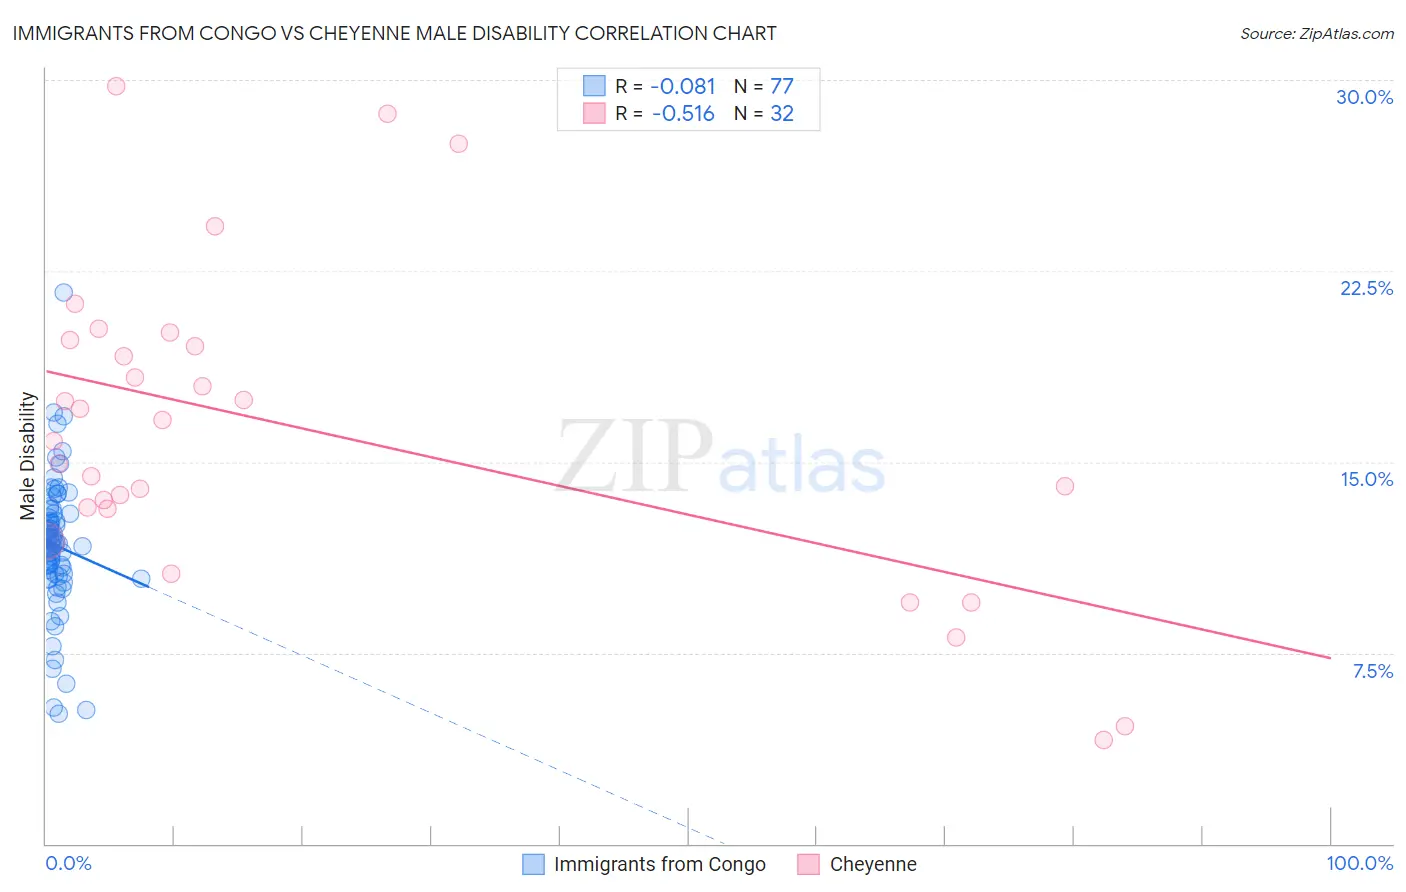
Immigrants from Congo vs Cheyenne Male Disability Correlation Chart
The statistical analysis conducted on geographies consisting of 92,121,223 people shows a slight negative correlation between the proportion of Immigrants from Congo and percentage of males with a disability in the United States with a correlation coefficient (R) of -0.081 and weighted average of 11.7%. Similarly, the statistical analysis conducted on geographies consisting of 80,709,657 people shows a substantial negative correlation between the proportion of Cheyenne and percentage of males with a disability in the United States with a correlation coefficient (R) of -0.516 and weighted average of 13.0%, a difference of 11.2%.
Male Disability Correlation Summary
| Measurement | Immigrants from Congo | Cheyenne |
| Minimum | 5.1% | 4.1% |
| Maximum | 21.7% | 29.8% |
| Range | 16.5% | 25.7% |
| Mean | 11.7% | 16.3% |
| Median | 11.8% | 16.2% |
| Interquartile 25% (IQ1) | 10.6% | 13.2% |
| Interquartile 75% (IQ3) | 12.9% | 19.7% |
| Interquartile Range (IQR) | 2.4% | 6.5% |
| Standard Deviation (Sample) | 2.7% | 6.1% |
| Standard Deviation (Population) | 2.6% | 6.0% |
Similar Demographics by Male Disability
Demographics Similar to Immigrants from Congo by Male Disability
In terms of male disability, the demographic groups most similar to Immigrants from Congo are Immigrants from Western Europe (11.7%, a difference of 0.010%), Panamanian (11.7%, a difference of 0.020%), Immigrants from England (11.7%, a difference of 0.080%), Alsatian (11.7%, a difference of 0.15%), and Immigrants from Bahamas (11.7%, a difference of 0.24%).
| Demographics | Rating | Rank | Male Disability |
| Lithuanians | 6.6 /100 | #214 | Tragic 11.6% |
| Indonesians | 5.9 /100 | #215 | Tragic 11.6% |
| Immigrants | Dominican Republic | 4.9 /100 | #216 | Tragic 11.7% |
| Immigrants | Dominica | 4.6 /100 | #217 | Tragic 11.7% |
| Immigrants | England | 4.0 /100 | #218 | Tragic 11.7% |
| Panamanians | 3.8 /100 | #219 | Tragic 11.7% |
| Immigrants | Western Europe | 3.8 /100 | #220 | Tragic 11.7% |
| Immigrants | Congo | 3.7 /100 | #221 | Tragic 11.7% |
| Alsatians | 3.3 /100 | #222 | Tragic 11.7% |
| Immigrants | Bahamas | 3.2 /100 | #223 | Tragic 11.7% |
| Japanese | 3.1 /100 | #224 | Tragic 11.7% |
| Liberians | 3.1 /100 | #225 | Tragic 11.8% |
| Sub-Saharan Africans | 2.8 /100 | #226 | Tragic 11.8% |
| Austrians | 2.5 /100 | #227 | Tragic 11.8% |
| Hispanics or Latinos | 2.3 /100 | #228 | Tragic 11.8% |
Demographics Similar to Cheyenne by Male Disability
In terms of male disability, the demographic groups most similar to Cheyenne are French (13.0%, a difference of 0.040%), Celtic (13.0%, a difference of 0.090%), Pennsylvania German (13.0%, a difference of 0.44%), Crow (13.1%, a difference of 0.63%), and Inupiat (13.0%, a difference of 0.64%).
| Demographics | Rating | Rank | Male Disability |
| Yaqui | 0.0 /100 | #293 | Tragic 12.9% |
| Marshallese | 0.0 /100 | #294 | Tragic 12.9% |
| Immigrants | Micronesia | 0.0 /100 | #295 | Tragic 12.9% |
| Immigrants | Nonimmigrants | 0.0 /100 | #296 | Tragic 12.9% |
| Inupiat | 0.0 /100 | #297 | Tragic 13.0% |
| Pennsylvania Germans | 0.0 /100 | #298 | Tragic 13.0% |
| Celtics | 0.0 /100 | #299 | Tragic 13.0% |
| Cheyenne | 0.0 /100 | #300 | Tragic 13.0% |
| French | 0.0 /100 | #301 | Tragic 13.0% |
| Crow | 0.0 /100 | #302 | Tragic 13.1% |
| Scotch-Irish | 0.0 /100 | #303 | Tragic 13.2% |
| Blacks/African Americans | 0.0 /100 | #304 | Tragic 13.2% |
| French Canadians | 0.0 /100 | #305 | Tragic 13.3% |
| Spanish Americans | 0.0 /100 | #306 | Tragic 13.3% |
| Arapaho | 0.0 /100 | #307 | Tragic 13.3% |