Immigrants from Jamaica vs Cheyenne Male Disability
COMPARE
Immigrants from Jamaica
Cheyenne
Male Disability
Male Disability Comparison
Immigrants from Jamaica
Cheyenne
11.5%
MALE DISABILITY
16.3/ 100
METRIC RATING
198th/ 347
METRIC RANK
13.0%
MALE DISABILITY
0.0/ 100
METRIC RATING
300th/ 347
METRIC RANK
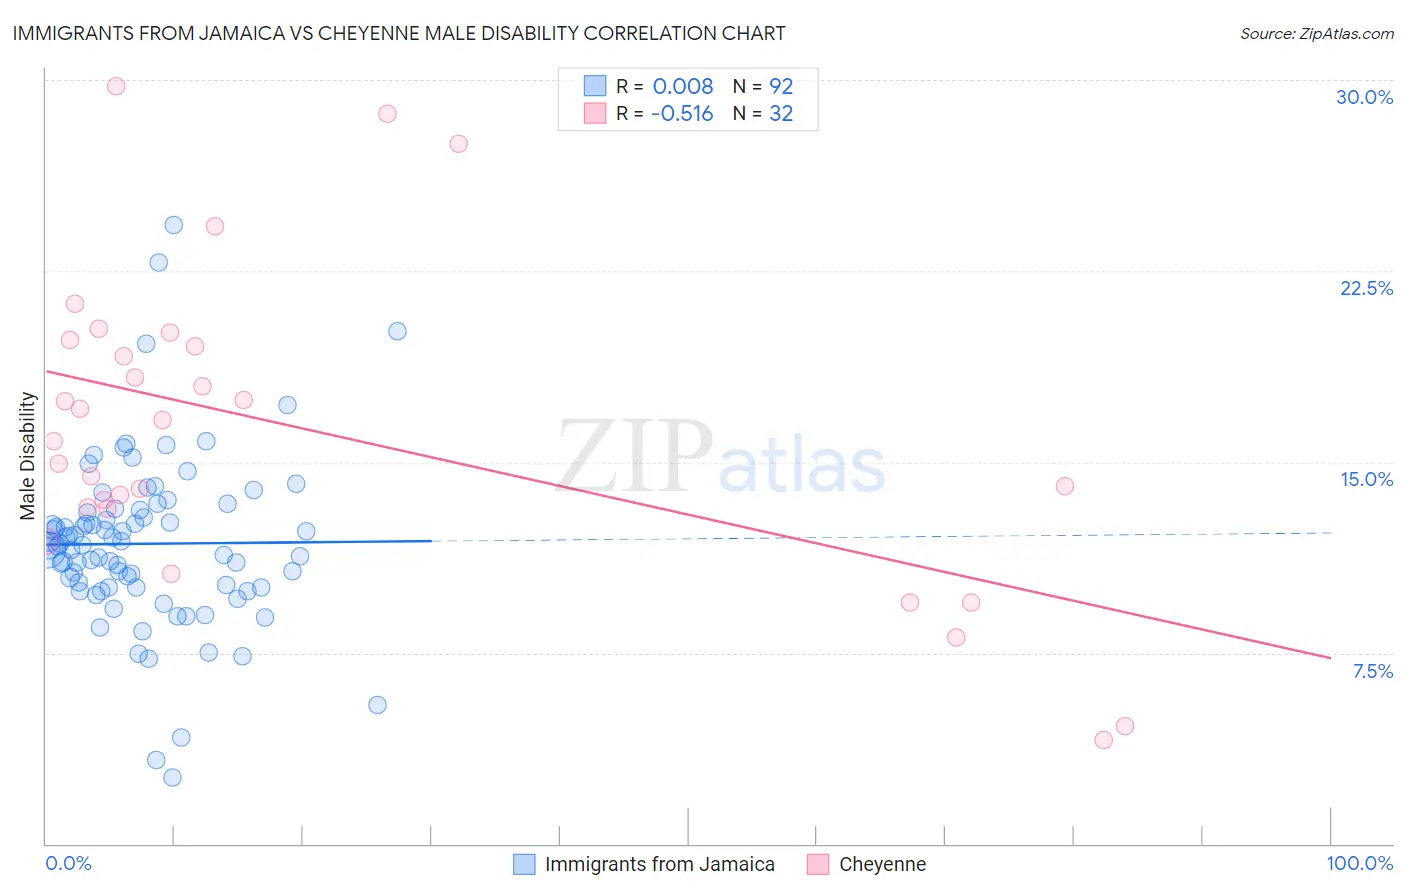
Immigrants from Jamaica vs Cheyenne Male Disability Correlation Chart
The statistical analysis conducted on geographies consisting of 301,738,521 people shows no correlation between the proportion of Immigrants from Jamaica and percentage of males with a disability in the United States with a correlation coefficient (R) of 0.008 and weighted average of 11.5%. Similarly, the statistical analysis conducted on geographies consisting of 80,709,657 people shows a substantial negative correlation between the proportion of Cheyenne and percentage of males with a disability in the United States with a correlation coefficient (R) of -0.516 and weighted average of 13.0%, a difference of 13.7%.
Male Disability Correlation Summary
| Measurement | Immigrants from Jamaica | Cheyenne |
| Minimum | 2.6% | 4.1% |
| Maximum | 24.3% | 29.8% |
| Range | 21.7% | 25.7% |
| Mean | 11.8% | 16.3% |
| Median | 11.7% | 16.2% |
| Interquartile 25% (IQ1) | 10.1% | 13.2% |
| Interquartile 75% (IQ3) | 13.1% | 19.7% |
| Interquartile Range (IQR) | 3.0% | 6.5% |
| Standard Deviation (Sample) | 3.4% | 6.1% |
| Standard Deviation (Population) | 3.3% | 6.0% |
Similar Demographics by Male Disability
Demographics Similar to Immigrants from Jamaica by Male Disability
In terms of male disability, the demographic groups most similar to Immigrants from Jamaica are Lebanese (11.5%, a difference of 0.090%), Somali (11.4%, a difference of 0.18%), West Indian (11.4%, a difference of 0.20%), Immigrants from Iraq (11.5%, a difference of 0.36%), and Immigrants from Panama (11.5%, a difference of 0.36%).
| Demographics | Rating | Rank | Male Disability |
| Senegalese | 23.2 /100 | #191 | Fair 11.4% |
| Assyrians/Chaldeans/Syriacs | 23.2 /100 | #192 | Fair 11.4% |
| Greeks | 22.2 /100 | #193 | Fair 11.4% |
| Belizeans | 21.2 /100 | #194 | Fair 11.4% |
| Immigrants | Oceania | 20.9 /100 | #195 | Fair 11.4% |
| West Indians | 18.4 /100 | #196 | Poor 11.4% |
| Somalis | 18.2 /100 | #197 | Poor 11.4% |
| Immigrants | Jamaica | 16.3 /100 | #198 | Poor 11.5% |
| Lebanese | 15.4 /100 | #199 | Poor 11.5% |
| Immigrants | Iraq | 13.0 /100 | #200 | Poor 11.5% |
| Immigrants | Panama | 13.0 /100 | #201 | Poor 11.5% |
| Immigrants | Mexico | 12.6 /100 | #202 | Poor 11.5% |
| Jamaicans | 10.9 /100 | #203 | Poor 11.5% |
| Immigrants | Cambodia | 10.8 /100 | #204 | Poor 11.5% |
| Serbians | 10.7 /100 | #205 | Poor 11.5% |
Demographics Similar to Cheyenne by Male Disability
In terms of male disability, the demographic groups most similar to Cheyenne are French (13.0%, a difference of 0.040%), Celtic (13.0%, a difference of 0.090%), Pennsylvania German (13.0%, a difference of 0.44%), Crow (13.1%, a difference of 0.63%), and Inupiat (13.0%, a difference of 0.64%).
| Demographics | Rating | Rank | Male Disability |
| Yaqui | 0.0 /100 | #293 | Tragic 12.9% |
| Marshallese | 0.0 /100 | #294 | Tragic 12.9% |
| Immigrants | Micronesia | 0.0 /100 | #295 | Tragic 12.9% |
| Immigrants | Nonimmigrants | 0.0 /100 | #296 | Tragic 12.9% |
| Inupiat | 0.0 /100 | #297 | Tragic 13.0% |
| Pennsylvania Germans | 0.0 /100 | #298 | Tragic 13.0% |
| Celtics | 0.0 /100 | #299 | Tragic 13.0% |
| Cheyenne | 0.0 /100 | #300 | Tragic 13.0% |
| French | 0.0 /100 | #301 | Tragic 13.0% |
| Crow | 0.0 /100 | #302 | Tragic 13.1% |
| Scotch-Irish | 0.0 /100 | #303 | Tragic 13.2% |
| Blacks/African Americans | 0.0 /100 | #304 | Tragic 13.2% |
| French Canadians | 0.0 /100 | #305 | Tragic 13.3% |
| Spanish Americans | 0.0 /100 | #306 | Tragic 13.3% |
| Arapaho | 0.0 /100 | #307 | Tragic 13.3% |