Iranian vs Cheyenne Male Disability
COMPARE
Iranian
Cheyenne
Male Disability
Male Disability Comparison
Iranians
Cheyenne
9.7%
MALE DISABILITY
100.0/ 100
METRIC RATING
13th/ 347
METRIC RANK
13.0%
MALE DISABILITY
0.0/ 100
METRIC RATING
300th/ 347
METRIC RANK
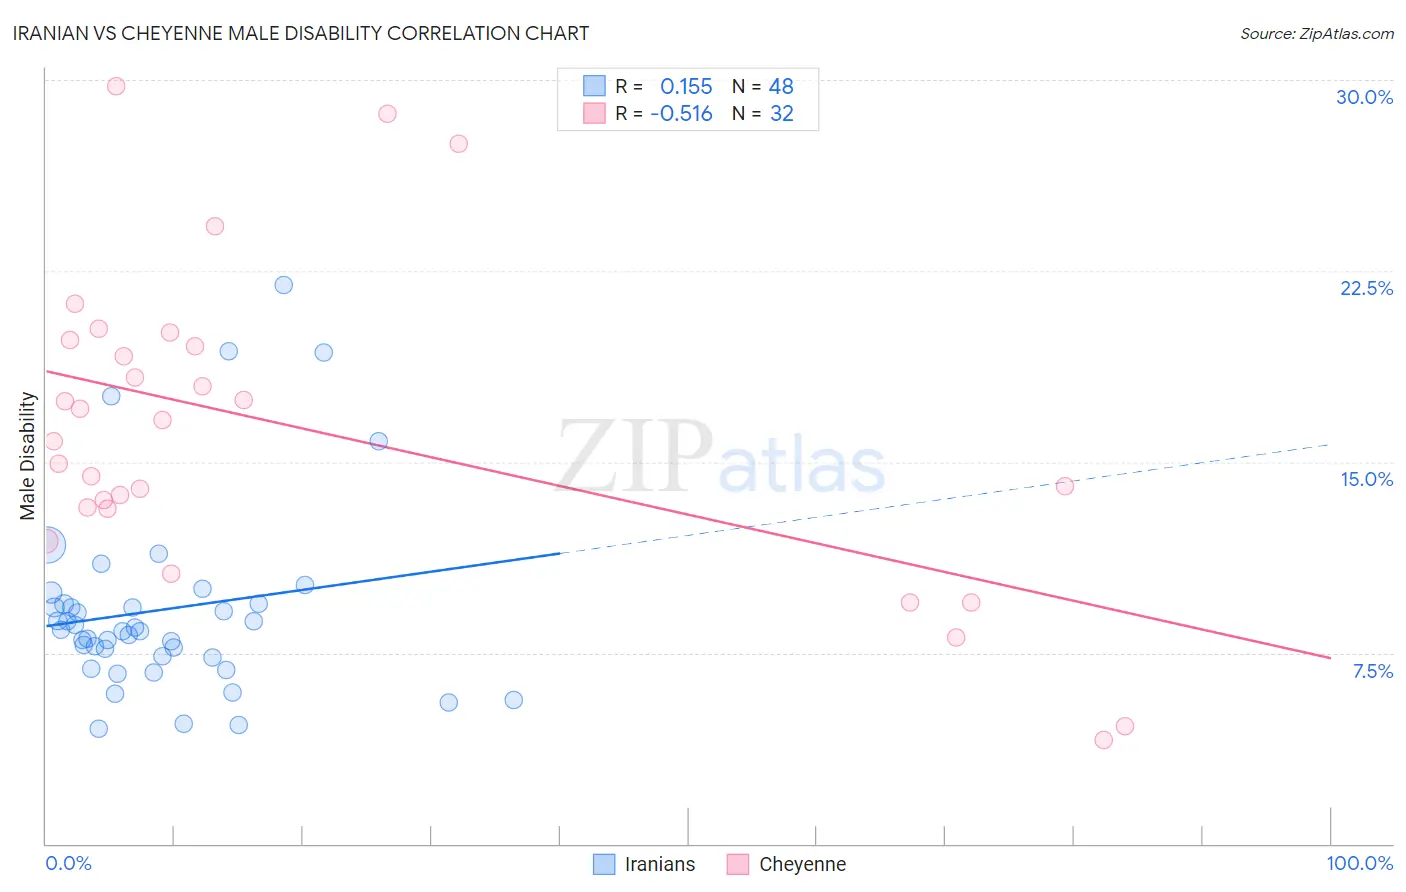
Iranian vs Cheyenne Male Disability Correlation Chart
The statistical analysis conducted on geographies consisting of 316,851,194 people shows a poor positive correlation between the proportion of Iranians and percentage of males with a disability in the United States with a correlation coefficient (R) of 0.155 and weighted average of 9.7%. Similarly, the statistical analysis conducted on geographies consisting of 80,709,657 people shows a substantial negative correlation between the proportion of Cheyenne and percentage of males with a disability in the United States with a correlation coefficient (R) of -0.516 and weighted average of 13.0%, a difference of 34.9%.
Male Disability Correlation Summary
| Measurement | Iranian | Cheyenne |
| Minimum | 4.5% | 4.1% |
| Maximum | 21.9% | 29.8% |
| Range | 17.4% | 25.7% |
| Mean | 9.2% | 16.3% |
| Median | 8.4% | 16.2% |
| Interquartile 25% (IQ1) | 7.4% | 13.2% |
| Interquartile 75% (IQ3) | 9.4% | 19.7% |
| Interquartile Range (IQR) | 2.1% | 6.5% |
| Standard Deviation (Sample) | 3.7% | 6.1% |
| Standard Deviation (Population) | 3.7% | 6.0% |
Similar Demographics by Male Disability
Demographics Similar to Iranians by Male Disability
In terms of male disability, the demographic groups most similar to Iranians are Immigrants from Iran (9.7%, a difference of 0.10%), Bolivian (9.6%, a difference of 0.23%), Immigrants from Eastern Asia (9.6%, a difference of 0.46%), Indian (Asian) (9.7%, a difference of 0.55%), and Immigrants from Israel (9.6%, a difference of 1.0%).
| Demographics | Rating | Rank | Male Disability |
| Immigrants | South Central Asia | 100.0 /100 | #6 | Exceptional 9.4% |
| Immigrants | Bolivia | 100.0 /100 | #7 | Exceptional 9.5% |
| Immigrants | China | 100.0 /100 | #8 | Exceptional 9.5% |
| Immigrants | Singapore | 100.0 /100 | #9 | Exceptional 9.5% |
| Immigrants | Israel | 100.0 /100 | #10 | Exceptional 9.6% |
| Immigrants | Eastern Asia | 100.0 /100 | #11 | Exceptional 9.6% |
| Bolivians | 100.0 /100 | #12 | Exceptional 9.6% |
| Iranians | 100.0 /100 | #13 | Exceptional 9.7% |
| Immigrants | Iran | 100.0 /100 | #14 | Exceptional 9.7% |
| Indians (Asian) | 100.0 /100 | #15 | Exceptional 9.7% |
| Okinawans | 100.0 /100 | #16 | Exceptional 9.8% |
| Immigrants | Korea | 100.0 /100 | #17 | Exceptional 9.8% |
| Immigrants | Pakistan | 100.0 /100 | #18 | Exceptional 9.8% |
| Immigrants | Sri Lanka | 100.0 /100 | #19 | Exceptional 10.0% |
| Asians | 100.0 /100 | #20 | Exceptional 10.0% |
Demographics Similar to Cheyenne by Male Disability
In terms of male disability, the demographic groups most similar to Cheyenne are French (13.0%, a difference of 0.040%), Celtic (13.0%, a difference of 0.090%), Pennsylvania German (13.0%, a difference of 0.44%), Crow (13.1%, a difference of 0.63%), and Inupiat (13.0%, a difference of 0.64%).
| Demographics | Rating | Rank | Male Disability |
| Yaqui | 0.0 /100 | #293 | Tragic 12.9% |
| Marshallese | 0.0 /100 | #294 | Tragic 12.9% |
| Immigrants | Micronesia | 0.0 /100 | #295 | Tragic 12.9% |
| Immigrants | Nonimmigrants | 0.0 /100 | #296 | Tragic 12.9% |
| Inupiat | 0.0 /100 | #297 | Tragic 13.0% |
| Pennsylvania Germans | 0.0 /100 | #298 | Tragic 13.0% |
| Celtics | 0.0 /100 | #299 | Tragic 13.0% |
| Cheyenne | 0.0 /100 | #300 | Tragic 13.0% |
| French | 0.0 /100 | #301 | Tragic 13.0% |
| Crow | 0.0 /100 | #302 | Tragic 13.1% |
| Scotch-Irish | 0.0 /100 | #303 | Tragic 13.2% |
| Blacks/African Americans | 0.0 /100 | #304 | Tragic 13.2% |
| French Canadians | 0.0 /100 | #305 | Tragic 13.3% |
| Spanish Americans | 0.0 /100 | #306 | Tragic 13.3% |
| Arapaho | 0.0 /100 | #307 | Tragic 13.3% |