Immigrants from Congo vs Northern European Male Disability
COMPARE
Immigrants from Congo
Northern European
Male Disability
Male Disability Comparison
Immigrants from Congo
Northern Europeans
11.7%
MALE DISABILITY
3.7/ 100
METRIC RATING
221st/ 347
METRIC RANK
11.9%
MALE DISABILITY
1.1/ 100
METRIC RATING
242nd/ 347
METRIC RANK
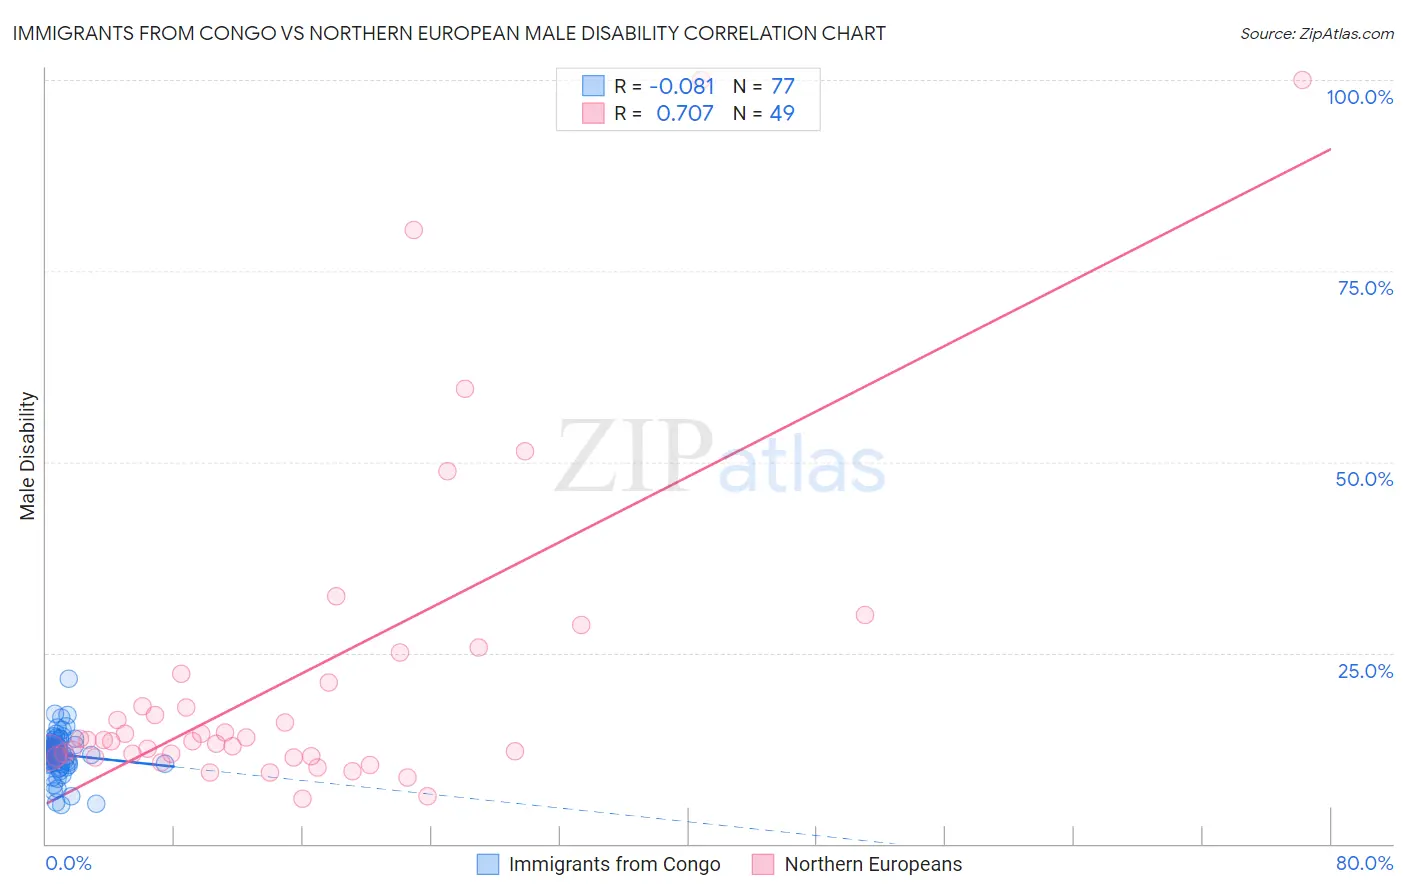
Immigrants from Congo vs Northern European Male Disability Correlation Chart
The statistical analysis conducted on geographies consisting of 92,121,223 people shows a slight negative correlation between the proportion of Immigrants from Congo and percentage of males with a disability in the United States with a correlation coefficient (R) of -0.081 and weighted average of 11.7%. Similarly, the statistical analysis conducted on geographies consisting of 406,040,370 people shows a strong positive correlation between the proportion of Northern Europeans and percentage of males with a disability in the United States with a correlation coefficient (R) of 0.707 and weighted average of 11.9%, a difference of 1.7%.
Male Disability Correlation Summary
| Measurement | Immigrants from Congo | Northern European |
| Minimum | 5.1% | 5.8% |
| Maximum | 21.7% | 100.0% |
| Range | 16.5% | 94.2% |
| Mean | 11.7% | 21.8% |
| Median | 11.8% | 13.6% |
| Interquartile 25% (IQ1) | 10.6% | 11.5% |
| Interquartile 75% (IQ3) | 12.9% | 21.7% |
| Interquartile Range (IQR) | 2.4% | 10.3% |
| Standard Deviation (Sample) | 2.7% | 21.6% |
| Standard Deviation (Population) | 2.6% | 21.4% |
Similar Demographics by Male Disability
Demographics Similar to Immigrants from Congo by Male Disability
In terms of male disability, the demographic groups most similar to Immigrants from Congo are Immigrants from Western Europe (11.7%, a difference of 0.010%), Panamanian (11.7%, a difference of 0.020%), Immigrants from England (11.7%, a difference of 0.080%), Alsatian (11.7%, a difference of 0.15%), and Immigrants from Bahamas (11.7%, a difference of 0.24%).
| Demographics | Rating | Rank | Male Disability |
| Lithuanians | 6.6 /100 | #214 | Tragic 11.6% |
| Indonesians | 5.9 /100 | #215 | Tragic 11.6% |
| Immigrants | Dominican Republic | 4.9 /100 | #216 | Tragic 11.7% |
| Immigrants | Dominica | 4.6 /100 | #217 | Tragic 11.7% |
| Immigrants | England | 4.0 /100 | #218 | Tragic 11.7% |
| Panamanians | 3.8 /100 | #219 | Tragic 11.7% |
| Immigrants | Western Europe | 3.8 /100 | #220 | Tragic 11.7% |
| Immigrants | Congo | 3.7 /100 | #221 | Tragic 11.7% |
| Alsatians | 3.3 /100 | #222 | Tragic 11.7% |
| Immigrants | Bahamas | 3.2 /100 | #223 | Tragic 11.7% |
| Japanese | 3.1 /100 | #224 | Tragic 11.7% |
| Liberians | 3.1 /100 | #225 | Tragic 11.8% |
| Sub-Saharan Africans | 2.8 /100 | #226 | Tragic 11.8% |
| Austrians | 2.5 /100 | #227 | Tragic 11.8% |
| Hispanics or Latinos | 2.3 /100 | #228 | Tragic 11.8% |
Demographics Similar to Northern Europeans by Male Disability
In terms of male disability, the demographic groups most similar to Northern Europeans are Bahamian (11.9%, a difference of 0.010%), Samoan (11.9%, a difference of 0.030%), Czech (11.9%, a difference of 0.050%), Italian (11.9%, a difference of 0.10%), and Immigrants from Laos (11.9%, a difference of 0.14%).
| Demographics | Rating | Rank | Male Disability |
| Immigrants | North America | 1.5 /100 | #235 | Tragic 11.9% |
| U.S. Virgin Islanders | 1.3 /100 | #236 | Tragic 11.9% |
| Carpatho Rusyns | 1.3 /100 | #237 | Tragic 11.9% |
| Yugoslavians | 1.2 /100 | #238 | Tragic 11.9% |
| Italians | 1.2 /100 | #239 | Tragic 11.9% |
| Czechs | 1.1 /100 | #240 | Tragic 11.9% |
| Bahamians | 1.1 /100 | #241 | Tragic 11.9% |
| Northern Europeans | 1.1 /100 | #242 | Tragic 11.9% |
| Samoans | 1.1 /100 | #243 | Tragic 11.9% |
| Immigrants | Laos | 1.0 /100 | #244 | Tragic 11.9% |
| Immigrants | Liberia | 1.0 /100 | #245 | Tragic 11.9% |
| Danes | 0.9 /100 | #246 | Tragic 11.9% |
| Hungarians | 0.8 /100 | #247 | Tragic 12.0% |
| Poles | 0.7 /100 | #248 | Tragic 12.0% |
| Immigrants | Yemen | 0.5 /100 | #249 | Tragic 12.0% |