Samoan vs Cheyenne Male Disability
COMPARE
Samoan
Cheyenne
Male Disability
Male Disability Comparison
Samoans
Cheyenne
11.9%
MALE DISABILITY
1.1/ 100
METRIC RATING
243rd/ 347
METRIC RANK
13.0%
MALE DISABILITY
0.0/ 100
METRIC RATING
300th/ 347
METRIC RANK
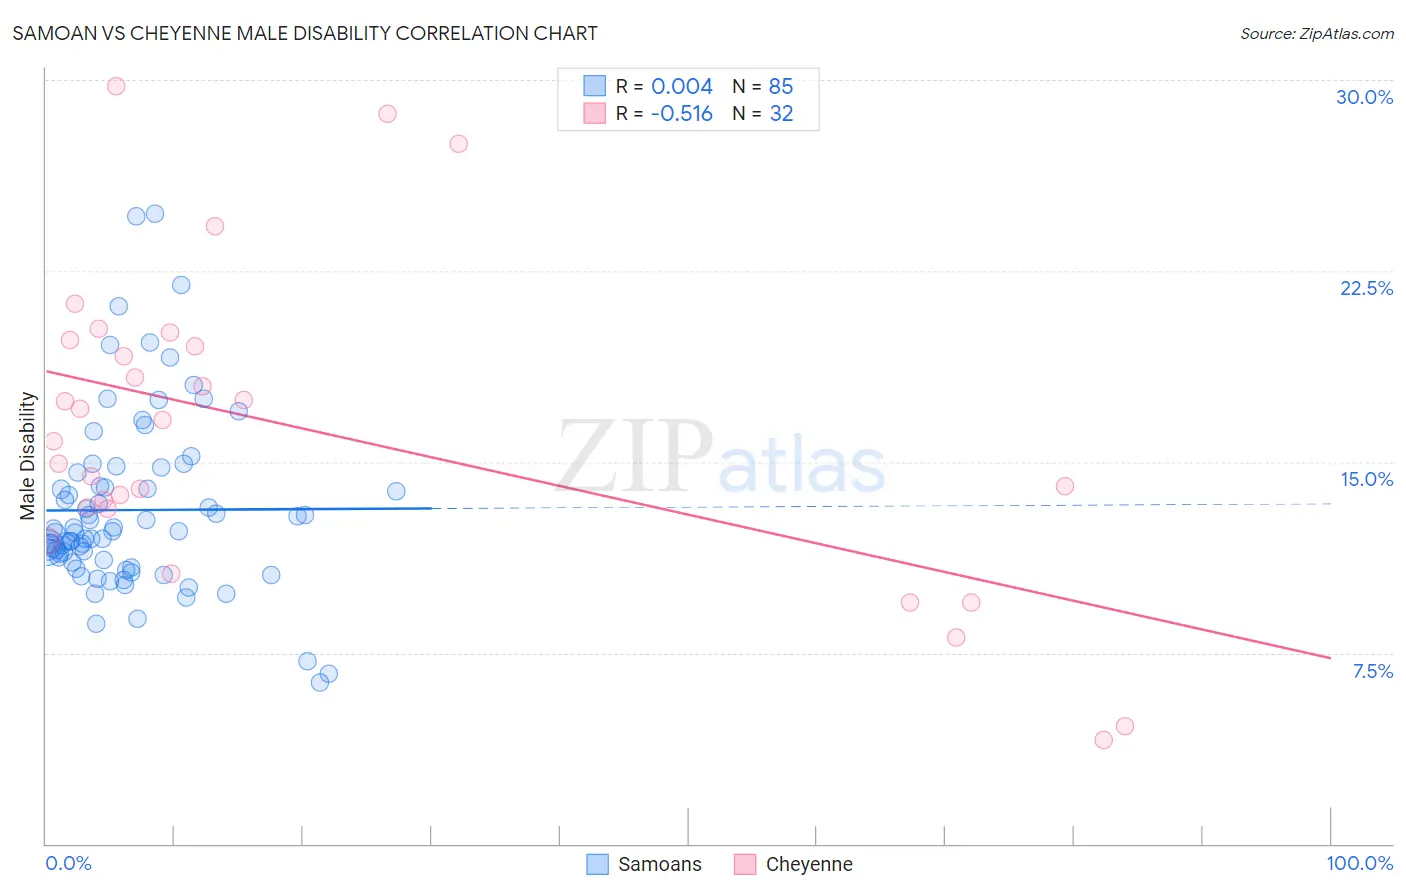
Samoan vs Cheyenne Male Disability Correlation Chart
The statistical analysis conducted on geographies consisting of 225,113,160 people shows no correlation between the proportion of Samoans and percentage of males with a disability in the United States with a correlation coefficient (R) of 0.004 and weighted average of 11.9%. Similarly, the statistical analysis conducted on geographies consisting of 80,709,657 people shows a substantial negative correlation between the proportion of Cheyenne and percentage of males with a disability in the United States with a correlation coefficient (R) of -0.516 and weighted average of 13.0%, a difference of 9.4%.
Male Disability Correlation Summary
| Measurement | Samoan | Cheyenne |
| Minimum | 6.3% | 4.1% |
| Maximum | 24.8% | 29.8% |
| Range | 18.4% | 25.7% |
| Mean | 13.1% | 16.3% |
| Median | 12.2% | 16.2% |
| Interquartile 25% (IQ1) | 11.1% | 13.2% |
| Interquartile 75% (IQ3) | 14.3% | 19.7% |
| Interquartile Range (IQR) | 3.2% | 6.5% |
| Standard Deviation (Sample) | 3.5% | 6.1% |
| Standard Deviation (Population) | 3.5% | 6.0% |
Similar Demographics by Male Disability
Demographics Similar to Samoans by Male Disability
In terms of male disability, the demographic groups most similar to Samoans are Northern European (11.9%, a difference of 0.030%), Bahamian (11.9%, a difference of 0.040%), Czech (11.9%, a difference of 0.080%), Immigrants from Laos (11.9%, a difference of 0.11%), and Immigrants from Liberia (11.9%, a difference of 0.12%).
| Demographics | Rating | Rank | Male Disability |
| U.S. Virgin Islanders | 1.3 /100 | #236 | Tragic 11.9% |
| Carpatho Rusyns | 1.3 /100 | #237 | Tragic 11.9% |
| Yugoslavians | 1.2 /100 | #238 | Tragic 11.9% |
| Italians | 1.2 /100 | #239 | Tragic 11.9% |
| Czechs | 1.1 /100 | #240 | Tragic 11.9% |
| Bahamians | 1.1 /100 | #241 | Tragic 11.9% |
| Northern Europeans | 1.1 /100 | #242 | Tragic 11.9% |
| Samoans | 1.1 /100 | #243 | Tragic 11.9% |
| Immigrants | Laos | 1.0 /100 | #244 | Tragic 11.9% |
| Immigrants | Liberia | 1.0 /100 | #245 | Tragic 11.9% |
| Danes | 0.9 /100 | #246 | Tragic 11.9% |
| Hungarians | 0.8 /100 | #247 | Tragic 12.0% |
| Poles | 0.7 /100 | #248 | Tragic 12.0% |
| Immigrants | Yemen | 0.5 /100 | #249 | Tragic 12.0% |
| Bangladeshis | 0.5 /100 | #250 | Tragic 12.0% |
Demographics Similar to Cheyenne by Male Disability
In terms of male disability, the demographic groups most similar to Cheyenne are French (13.0%, a difference of 0.040%), Celtic (13.0%, a difference of 0.090%), Pennsylvania German (13.0%, a difference of 0.44%), Crow (13.1%, a difference of 0.63%), and Inupiat (13.0%, a difference of 0.64%).
| Demographics | Rating | Rank | Male Disability |
| Yaqui | 0.0 /100 | #293 | Tragic 12.9% |
| Marshallese | 0.0 /100 | #294 | Tragic 12.9% |
| Immigrants | Micronesia | 0.0 /100 | #295 | Tragic 12.9% |
| Immigrants | Nonimmigrants | 0.0 /100 | #296 | Tragic 12.9% |
| Inupiat | 0.0 /100 | #297 | Tragic 13.0% |
| Pennsylvania Germans | 0.0 /100 | #298 | Tragic 13.0% |
| Celtics | 0.0 /100 | #299 | Tragic 13.0% |
| Cheyenne | 0.0 /100 | #300 | Tragic 13.0% |
| French | 0.0 /100 | #301 | Tragic 13.0% |
| Crow | 0.0 /100 | #302 | Tragic 13.1% |
| Scotch-Irish | 0.0 /100 | #303 | Tragic 13.2% |
| Blacks/African Americans | 0.0 /100 | #304 | Tragic 13.2% |
| French Canadians | 0.0 /100 | #305 | Tragic 13.3% |
| Spanish Americans | 0.0 /100 | #306 | Tragic 13.3% |
| Arapaho | 0.0 /100 | #307 | Tragic 13.3% |