Barbadian vs Cheyenne Male Disability
COMPARE
Barbadian
Cheyenne
Male Disability
Male Disability Comparison
Barbadians
Cheyenne
11.2%
MALE DISABILITY
53.4/ 100
METRIC RATING
169th/ 347
METRIC RANK
13.0%
MALE DISABILITY
0.0/ 100
METRIC RATING
300th/ 347
METRIC RANK
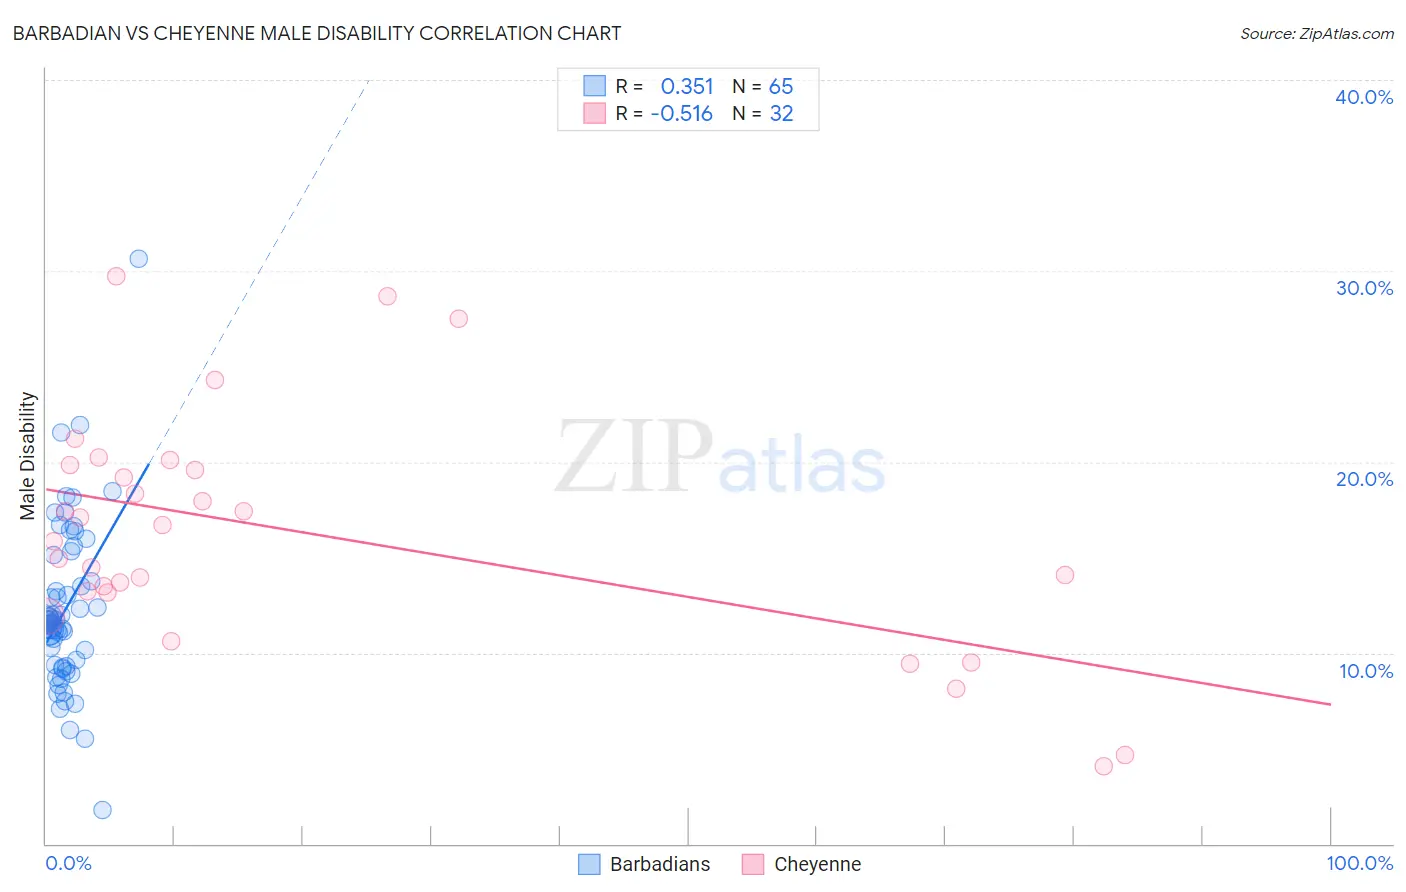
Barbadian vs Cheyenne Male Disability Correlation Chart
The statistical analysis conducted on geographies consisting of 141,288,845 people shows a mild positive correlation between the proportion of Barbadians and percentage of males with a disability in the United States with a correlation coefficient (R) of 0.351 and weighted average of 11.2%. Similarly, the statistical analysis conducted on geographies consisting of 80,709,657 people shows a substantial negative correlation between the proportion of Cheyenne and percentage of males with a disability in the United States with a correlation coefficient (R) of -0.516 and weighted average of 13.0%, a difference of 16.4%.
Male Disability Correlation Summary
| Measurement | Barbadian | Cheyenne |
| Minimum | 1.8% | 4.1% |
| Maximum | 30.6% | 29.8% |
| Range | 28.8% | 25.7% |
| Mean | 12.3% | 16.3% |
| Median | 11.6% | 16.2% |
| Interquartile 25% (IQ1) | 9.3% | 13.2% |
| Interquartile 75% (IQ3) | 14.4% | 19.7% |
| Interquartile Range (IQR) | 5.1% | 6.5% |
| Standard Deviation (Sample) | 4.4% | 6.1% |
| Standard Deviation (Population) | 4.4% | 6.0% |
Similar Demographics by Male Disability
Demographics Similar to Barbadians by Male Disability
In terms of male disability, the demographic groups most similar to Barbadians are Immigrants from Latin America (11.2%, a difference of 0.030%), New Zealander (11.2%, a difference of 0.030%), Haitian (11.2%, a difference of 0.050%), Immigrants from Southern Europe (11.2%, a difference of 0.060%), and Romanian (11.2%, a difference of 0.15%).
| Demographics | Rating | Rank | Male Disability |
| Immigrants | Haiti | 65.3 /100 | #162 | Good 11.1% |
| Immigrants | Kenya | 63.8 /100 | #163 | Good 11.1% |
| British West Indians | 62.8 /100 | #164 | Good 11.1% |
| Luxembourgers | 61.9 /100 | #165 | Good 11.1% |
| Immigrants | Hungary | 61.2 /100 | #166 | Good 11.1% |
| Immigrants | Southern Europe | 54.4 /100 | #167 | Average 11.2% |
| Immigrants | Latin America | 54.0 /100 | #168 | Average 11.2% |
| Barbadians | 53.4 /100 | #169 | Average 11.2% |
| New Zealanders | 52.9 /100 | #170 | Average 11.2% |
| Haitians | 52.5 /100 | #171 | Average 11.2% |
| Romanians | 50.7 /100 | #172 | Average 11.2% |
| Immigrants | Burma/Myanmar | 50.4 /100 | #173 | Average 11.2% |
| Maltese | 50.0 /100 | #174 | Average 11.2% |
| Immigrants | Honduras | 48.7 /100 | #175 | Average 11.2% |
| Syrians | 46.6 /100 | #176 | Average 11.2% |
Demographics Similar to Cheyenne by Male Disability
In terms of male disability, the demographic groups most similar to Cheyenne are French (13.0%, a difference of 0.040%), Celtic (13.0%, a difference of 0.090%), Pennsylvania German (13.0%, a difference of 0.44%), Crow (13.1%, a difference of 0.63%), and Inupiat (13.0%, a difference of 0.64%).
| Demographics | Rating | Rank | Male Disability |
| Yaqui | 0.0 /100 | #293 | Tragic 12.9% |
| Marshallese | 0.0 /100 | #294 | Tragic 12.9% |
| Immigrants | Micronesia | 0.0 /100 | #295 | Tragic 12.9% |
| Immigrants | Nonimmigrants | 0.0 /100 | #296 | Tragic 12.9% |
| Inupiat | 0.0 /100 | #297 | Tragic 13.0% |
| Pennsylvania Germans | 0.0 /100 | #298 | Tragic 13.0% |
| Celtics | 0.0 /100 | #299 | Tragic 13.0% |
| Cheyenne | 0.0 /100 | #300 | Tragic 13.0% |
| French | 0.0 /100 | #301 | Tragic 13.0% |
| Crow | 0.0 /100 | #302 | Tragic 13.1% |
| Scotch-Irish | 0.0 /100 | #303 | Tragic 13.2% |
| Blacks/African Americans | 0.0 /100 | #304 | Tragic 13.2% |
| French Canadians | 0.0 /100 | #305 | Tragic 13.3% |
| Spanish Americans | 0.0 /100 | #306 | Tragic 13.3% |
| Arapaho | 0.0 /100 | #307 | Tragic 13.3% |