Immigrants from Caribbean vs Ecuadorian Ambulatory Disability
COMPARE
Immigrants from Caribbean
Ecuadorian
Ambulatory Disability
Ambulatory Disability Comparison
Immigrants from Caribbean
Ecuadorians
6.7%
AMBULATORY DISABILITY
0.0/ 100
METRIC RATING
279th/ 347
METRIC RANK
6.1%
AMBULATORY DISABILITY
60.5/ 100
METRIC RATING
168th/ 347
METRIC RANK
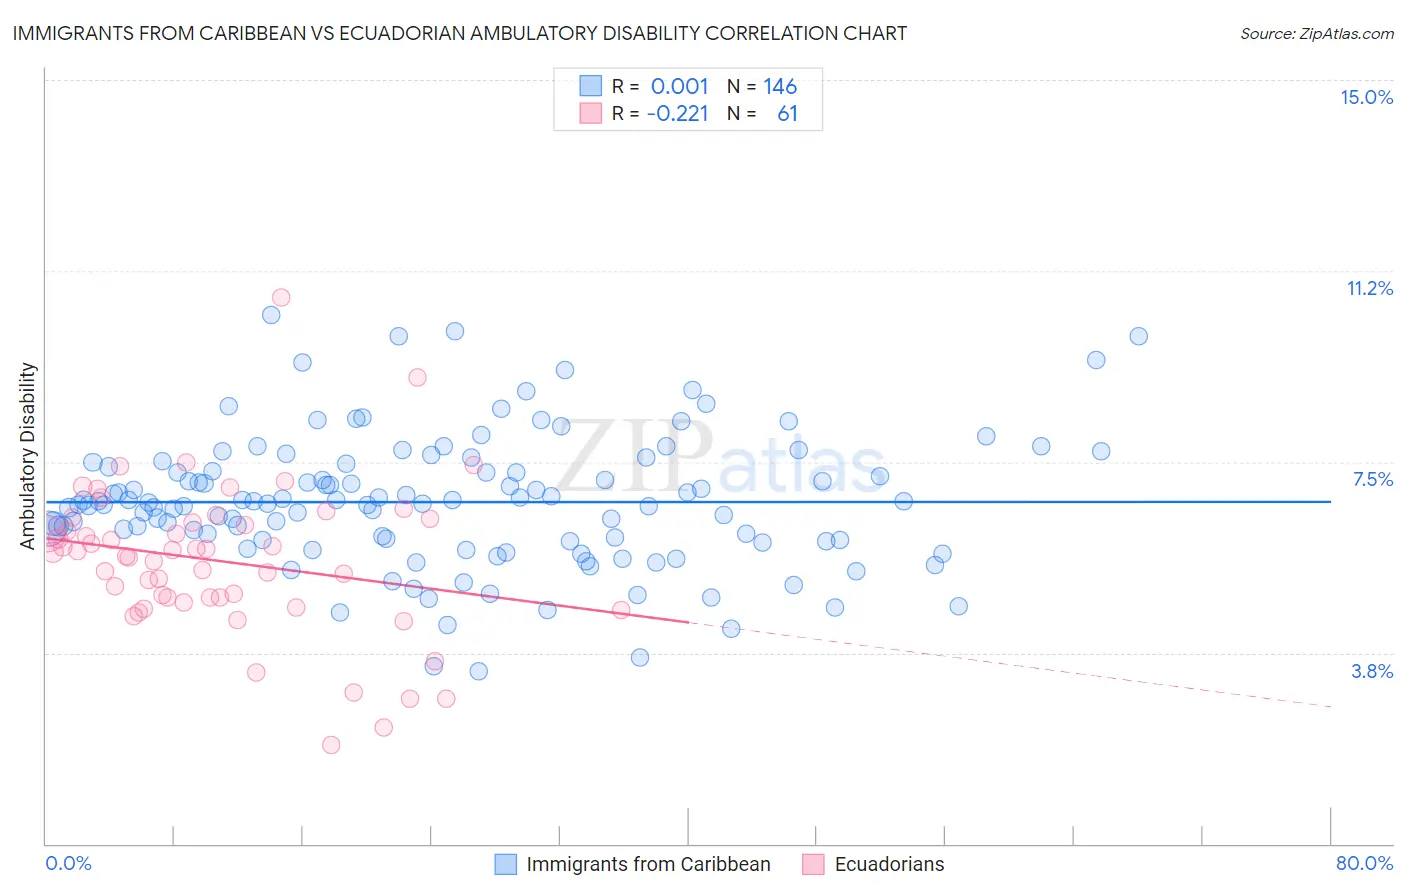
Immigrants from Caribbean vs Ecuadorian Ambulatory Disability Correlation Chart
The statistical analysis conducted on geographies consisting of 449,814,526 people shows no correlation between the proportion of Immigrants from Caribbean and percentage of population with ambulatory disability in the United States with a correlation coefficient (R) of 0.001 and weighted average of 6.7%. Similarly, the statistical analysis conducted on geographies consisting of 317,738,990 people shows a weak negative correlation between the proportion of Ecuadorians and percentage of population with ambulatory disability in the United States with a correlation coefficient (R) of -0.221 and weighted average of 6.1%, a difference of 10.9%.
Ambulatory Disability Correlation Summary
| Measurement | Immigrants from Caribbean | Ecuadorian |
| Minimum | 3.4% | 1.9% |
| Maximum | 10.4% | 10.7% |
| Range | 7.0% | 8.8% |
| Mean | 6.7% | 5.6% |
| Median | 6.7% | 5.7% |
| Interquartile 25% (IQ1) | 6.0% | 4.8% |
| Interquartile 75% (IQ3) | 7.4% | 6.3% |
| Interquartile Range (IQR) | 1.4% | 1.6% |
| Standard Deviation (Sample) | 1.3% | 1.5% |
| Standard Deviation (Population) | 1.3% | 1.5% |
Similar Demographics by Ambulatory Disability
Demographics Similar to Immigrants from Caribbean by Ambulatory Disability
In terms of ambulatory disability, the demographic groups most similar to Immigrants from Caribbean are Pennsylvania German (6.8%, a difference of 0.10%), Yaqui (6.8%, a difference of 0.17%), Barbadian (6.8%, a difference of 0.30%), Immigrants from West Indies (6.7%, a difference of 0.31%), and Jamaican (6.7%, a difference of 0.39%).
| Demographics | Rating | Rank | Ambulatory Disability |
| French Canadians | 0.1 /100 | #272 | Tragic 6.7% |
| Whites/Caucasians | 0.1 /100 | #273 | Tragic 6.7% |
| Sioux | 0.1 /100 | #274 | Tragic 6.7% |
| Immigrants | Guyana | 0.1 /100 | #275 | Tragic 6.7% |
| Celtics | 0.1 /100 | #276 | Tragic 6.7% |
| Jamaicans | 0.1 /100 | #277 | Tragic 6.7% |
| Immigrants | West Indies | 0.1 /100 | #278 | Tragic 6.7% |
| Immigrants | Caribbean | 0.0 /100 | #279 | Tragic 6.7% |
| Pennsylvania Germans | 0.0 /100 | #280 | Tragic 6.8% |
| Yaqui | 0.0 /100 | #281 | Tragic 6.8% |
| Barbadians | 0.0 /100 | #282 | Tragic 6.8% |
| Immigrants | Barbados | 0.0 /100 | #283 | Tragic 6.8% |
| Immigrants | Jamaica | 0.0 /100 | #284 | Tragic 6.8% |
| Fijians | 0.0 /100 | #285 | Tragic 6.8% |
| Yakama | 0.0 /100 | #286 | Tragic 6.8% |
Demographics Similar to Ecuadorians by Ambulatory Disability
In terms of ambulatory disability, the demographic groups most similar to Ecuadorians are Immigrants from Oceania (6.1%, a difference of 0.010%), Iraqi (6.1%, a difference of 0.13%), Immigrants from Southern Europe (6.1%, a difference of 0.14%), Nicaraguan (6.1%, a difference of 0.15%), and Basque (6.1%, a difference of 0.18%).
| Demographics | Rating | Rank | Ambulatory Disability |
| Immigrants | Belarus | 69.2 /100 | #161 | Good 6.1% |
| Nigerians | 67.1 /100 | #162 | Good 6.1% |
| Lebanese | 66.2 /100 | #163 | Good 6.1% |
| Basques | 63.7 /100 | #164 | Good 6.1% |
| Nicaraguans | 63.2 /100 | #165 | Good 6.1% |
| Iraqis | 62.8 /100 | #166 | Good 6.1% |
| Immigrants | Oceania | 60.7 /100 | #167 | Good 6.1% |
| Ecuadorians | 60.5 /100 | #168 | Good 6.1% |
| Immigrants | Southern Europe | 58.1 /100 | #169 | Average 6.1% |
| Immigrants | Ecuador | 53.8 /100 | #170 | Average 6.1% |
| Moroccans | 52.6 /100 | #171 | Average 6.1% |
| Immigrants | Burma/Myanmar | 52.2 /100 | #172 | Average 6.1% |
| Croatians | 51.2 /100 | #173 | Average 6.1% |
| Immigrants | Canada | 50.0 /100 | #174 | Average 6.1% |
| Vietnamese | 47.2 /100 | #175 | Average 6.1% |