Immigrants from Caribbean vs Chinese In Labor Force | Age 30-34
COMPARE
Immigrants from Caribbean
Chinese
In Labor Force | Age 30-34
In Labor Force | Age 30-34 Comparison
Immigrants from Caribbean
Chinese
84.0%
IN LABOR FORCE | AGE 30-34
1.1/ 100
METRIC RATING
243rd/ 347
METRIC RANK
85.0%
IN LABOR FORCE | AGE 30-34
89.6/ 100
METRIC RATING
131st/ 347
METRIC RANK
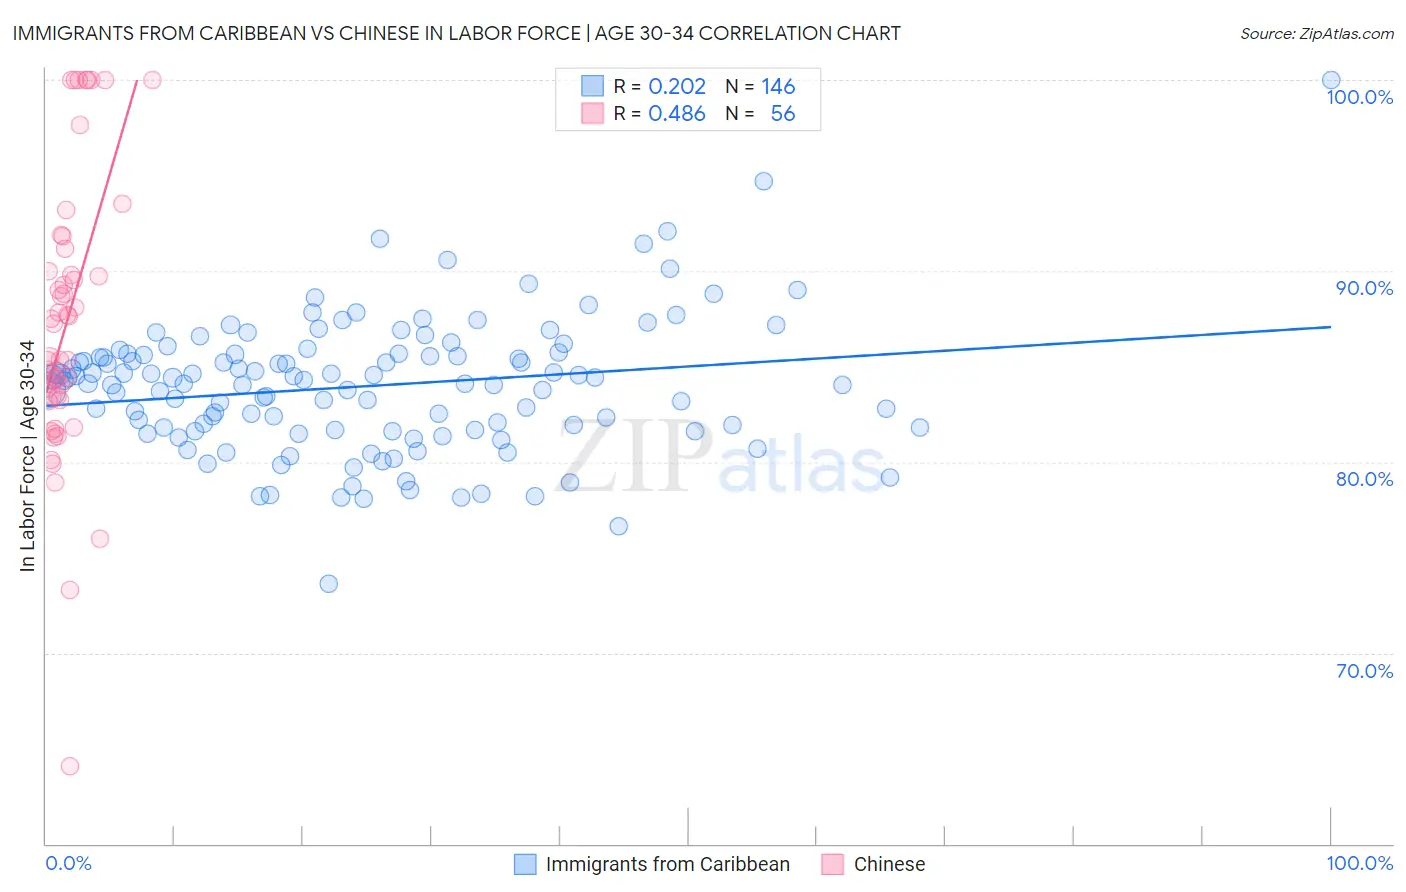
Immigrants from Caribbean vs Chinese In Labor Force | Age 30-34 Correlation Chart
The statistical analysis conducted on geographies consisting of 449,684,451 people shows a weak positive correlation between the proportion of Immigrants from Caribbean and labor force participation rate among population between the ages 30 and 34 in the United States with a correlation coefficient (R) of 0.202 and weighted average of 84.0%. Similarly, the statistical analysis conducted on geographies consisting of 64,801,795 people shows a moderate positive correlation between the proportion of Chinese and labor force participation rate among population between the ages 30 and 34 in the United States with a correlation coefficient (R) of 0.486 and weighted average of 85.0%, a difference of 1.2%.
In Labor Force | Age 30-34 Correlation Summary
| Measurement | Immigrants from Caribbean | Chinese |
| Minimum | 73.6% | 64.1% |
| Maximum | 100.0% | 100.0% |
| Range | 26.4% | 35.9% |
| Mean | 84.0% | 87.3% |
| Median | 84.2% | 86.4% |
| Interquartile 25% (IQ1) | 81.6% | 83.3% |
| Interquartile 75% (IQ3) | 85.6% | 90.6% |
| Interquartile Range (IQR) | 4.0% | 7.3% |
| Standard Deviation (Sample) | 3.5% | 7.3% |
| Standard Deviation (Population) | 3.5% | 7.3% |
Similar Demographics by In Labor Force | Age 30-34
Demographics Similar to Immigrants from Caribbean by In Labor Force | Age 30-34
In terms of in labor force | age 30-34, the demographic groups most similar to Immigrants from Caribbean are Immigrants from Oceania (84.0%, a difference of 0.010%), Immigrants from Portugal (84.0%, a difference of 0.020%), Basque (84.0%, a difference of 0.030%), Immigrants from Venezuela (84.0%, a difference of 0.030%), and Central American (84.0%, a difference of 0.030%).
| Demographics | Rating | Rank | In Labor Force | Age 30-34 |
| U.S. Virgin Islanders | 1.5 /100 | #236 | Tragic 84.1% |
| Celtics | 1.4 /100 | #237 | Tragic 84.1% |
| Immigrants | Barbados | 1.4 /100 | #238 | Tragic 84.0% |
| English | 1.4 /100 | #239 | Tragic 84.0% |
| Venezuelans | 1.3 /100 | #240 | Tragic 84.0% |
| Immigrants | Portugal | 1.2 /100 | #241 | Tragic 84.0% |
| Immigrants | Oceania | 1.1 /100 | #242 | Tragic 84.0% |
| Immigrants | Caribbean | 1.1 /100 | #243 | Tragic 84.0% |
| Basques | 0.9 /100 | #244 | Tragic 84.0% |
| Immigrants | Venezuela | 0.9 /100 | #245 | Tragic 84.0% |
| Central Americans | 0.9 /100 | #246 | Tragic 84.0% |
| British West Indians | 0.8 /100 | #247 | Tragic 84.0% |
| Portuguese | 0.8 /100 | #248 | Tragic 84.0% |
| Immigrants | Dominica | 0.7 /100 | #249 | Tragic 84.0% |
| Immigrants | Iraq | 0.7 /100 | #250 | Tragic 83.9% |
Demographics Similar to Chinese by In Labor Force | Age 30-34
In terms of in labor force | age 30-34, the demographic groups most similar to Chinese are Immigrants from Israel (85.0%, a difference of 0.0%), New Zealander (85.0%, a difference of 0.0%), Immigrants from Western Africa (85.0%, a difference of 0.010%), Immigrants from Spain (85.0%, a difference of 0.010%), and Immigrants from Chile (85.0%, a difference of 0.010%).
| Demographics | Rating | Rank | In Labor Force | Age 30-34 |
| Australians | 92.0 /100 | #124 | Exceptional 85.0% |
| Immigrants | Jordan | 91.5 /100 | #125 | Exceptional 85.0% |
| Austrians | 90.9 /100 | #126 | Exceptional 85.0% |
| Slavs | 90.7 /100 | #127 | Exceptional 85.0% |
| Immigrants | Argentina | 90.6 /100 | #128 | Exceptional 85.0% |
| Immigrants | Western Africa | 90.2 /100 | #129 | Exceptional 85.0% |
| Immigrants | Spain | 90.0 /100 | #130 | Exceptional 85.0% |
| Chinese | 89.6 /100 | #131 | Excellent 85.0% |
| Immigrants | Israel | 89.5 /100 | #132 | Excellent 85.0% |
| New Zealanders | 89.5 /100 | #133 | Excellent 85.0% |
| Immigrants | Chile | 89.2 /100 | #134 | Excellent 85.0% |
| Immigrants | Asia | 88.9 /100 | #135 | Excellent 85.0% |
| Jordanians | 88.6 /100 | #136 | Excellent 85.0% |
| South Africans | 88.0 /100 | #137 | Excellent 85.0% |
| Sri Lankans | 87.8 /100 | #138 | Excellent 85.0% |