Immigrants from Caribbean vs Chinese Disability Age 65 to 74
COMPARE
Immigrants from Caribbean
Chinese
Disability Age 65 to 74
Disability Age 65 to 74 Comparison
Immigrants from Caribbean
Chinese
24.6%
DISABILITY AGE 65 TO 74
2.6/ 100
METRIC RATING
239th/ 347
METRIC RANK
21.7%
DISABILITY AGE 65 TO 74
99.2/ 100
METRIC RATING
70th/ 347
METRIC RANK
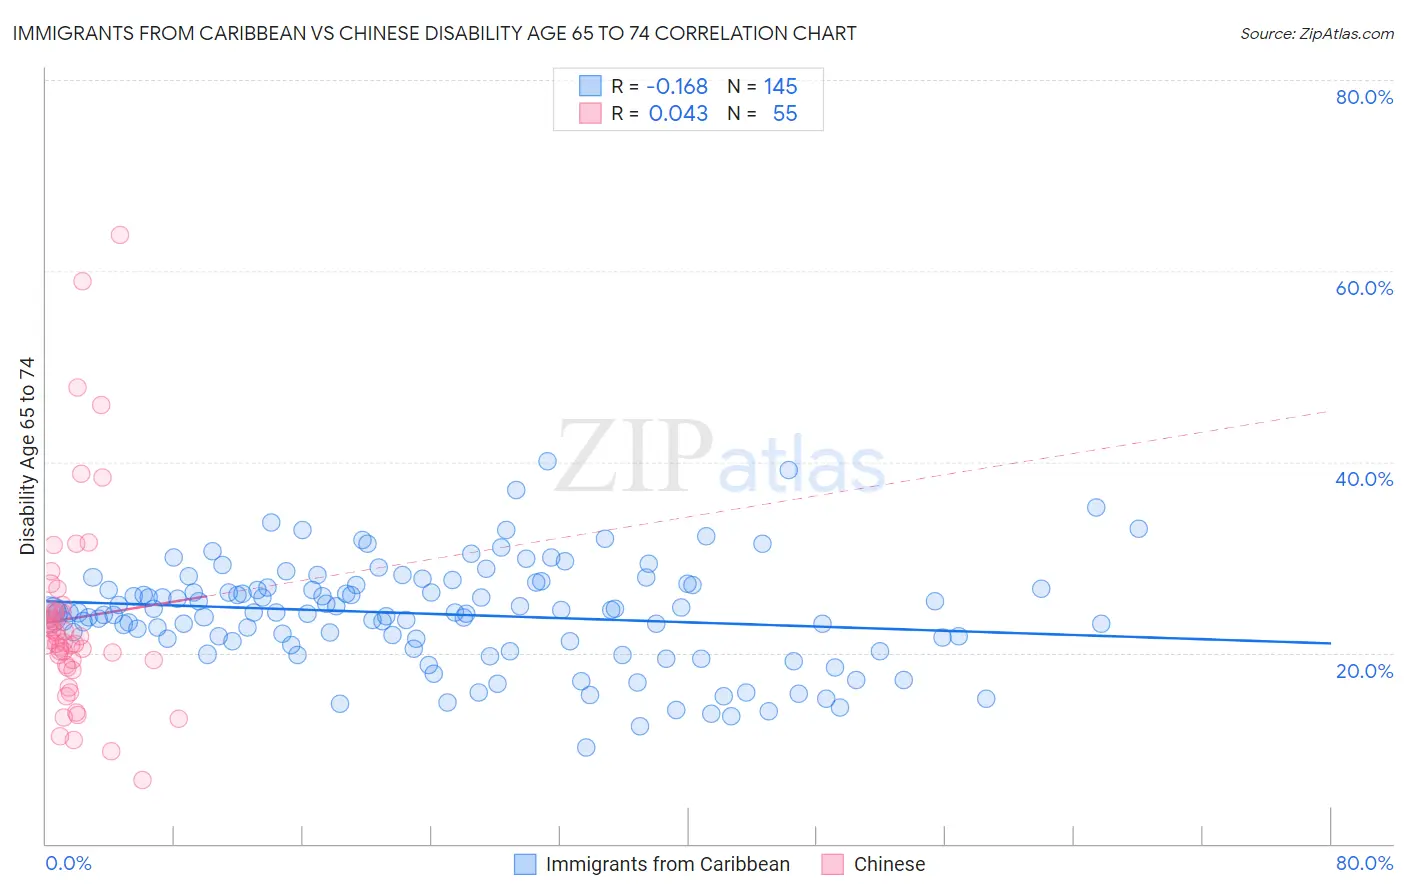
Immigrants from Caribbean vs Chinese Disability Age 65 to 74 Correlation Chart
The statistical analysis conducted on geographies consisting of 448,746,913 people shows a poor negative correlation between the proportion of Immigrants from Caribbean and percentage of population with a disability between the ages 65 and 75 in the United States with a correlation coefficient (R) of -0.168 and weighted average of 24.6%. Similarly, the statistical analysis conducted on geographies consisting of 64,752,265 people shows no correlation between the proportion of Chinese and percentage of population with a disability between the ages 65 and 75 in the United States with a correlation coefficient (R) of 0.043 and weighted average of 21.7%, a difference of 13.2%.
Disability Age 65 to 74 Correlation Summary
| Measurement | Immigrants from Caribbean | Chinese |
| Minimum | 10.1% | 6.7% |
| Maximum | 40.1% | 63.7% |
| Range | 30.0% | 57.1% |
| Mean | 24.0% | 23.6% |
| Median | 24.2% | 21.4% |
| Interquartile 25% (IQ1) | 21.2% | 18.8% |
| Interquartile 75% (IQ3) | 27.1% | 24.3% |
| Interquartile Range (IQR) | 5.9% | 5.6% |
| Standard Deviation (Sample) | 5.4% | 10.8% |
| Standard Deviation (Population) | 5.4% | 10.7% |
Similar Demographics by Disability Age 65 to 74
Demographics Similar to Immigrants from Caribbean by Disability Age 65 to 74
In terms of disability age 65 to 74, the demographic groups most similar to Immigrants from Caribbean are Spaniard (24.6%, a difference of 0.090%), Immigrants from Western Africa (24.6%, a difference of 0.17%), Immigrants from Ghana (24.5%, a difference of 0.22%), Immigrants from Senegal (24.6%, a difference of 0.25%), and Spanish (24.6%, a difference of 0.26%).
| Demographics | Rating | Rank | Disability Age 65 to 74 |
| Immigrants | Zaire | 5.0 /100 | #232 | Tragic 24.3% |
| Bahamians | 4.5 /100 | #233 | Tragic 24.4% |
| Panamanians | 4.2 /100 | #234 | Tragic 24.4% |
| Scotch-Irish | 3.8 /100 | #235 | Tragic 24.4% |
| German Russians | 3.7 /100 | #236 | Tragic 24.4% |
| West Indians | 3.4 /100 | #237 | Tragic 24.5% |
| Immigrants | Ghana | 3.0 /100 | #238 | Tragic 24.5% |
| Immigrants | Caribbean | 2.6 /100 | #239 | Tragic 24.6% |
| Spaniards | 2.4 /100 | #240 | Tragic 24.6% |
| Immigrants | Western Africa | 2.3 /100 | #241 | Tragic 24.6% |
| Immigrants | Senegal | 2.2 /100 | #242 | Tragic 24.6% |
| Spanish | 2.2 /100 | #243 | Tragic 24.6% |
| Armenians | 2.0 /100 | #244 | Tragic 24.7% |
| British West Indians | 2.0 /100 | #245 | Tragic 24.7% |
| Immigrants | Iraq | 1.9 /100 | #246 | Tragic 24.7% |
Demographics Similar to Chinese by Disability Age 65 to 74
In terms of disability age 65 to 74, the demographic groups most similar to Chinese are Immigrants from Egypt (21.7%, a difference of 0.0%), Immigrants from Belarus (21.7%, a difference of 0.060%), Immigrants from Hungary (21.7%, a difference of 0.070%), Immigrants from Scotland (21.7%, a difference of 0.13%), and Immigrants from South Africa (21.7%, a difference of 0.23%).
| Demographics | Rating | Rank | Disability Age 65 to 74 |
| Immigrants | Europe | 99.4 /100 | #63 | Exceptional 21.6% |
| Immigrants | Latvia | 99.4 /100 | #64 | Exceptional 21.6% |
| Immigrants | Russia | 99.4 /100 | #65 | Exceptional 21.6% |
| Maltese | 99.4 /100 | #66 | Exceptional 21.6% |
| Immigrants | South Africa | 99.3 /100 | #67 | Exceptional 21.7% |
| Immigrants | Scotland | 99.3 /100 | #68 | Exceptional 21.7% |
| Immigrants | Egypt | 99.2 /100 | #69 | Exceptional 21.7% |
| Chinese | 99.2 /100 | #70 | Exceptional 21.7% |
| Immigrants | Belarus | 99.2 /100 | #71 | Exceptional 21.7% |
| Immigrants | Hungary | 99.2 /100 | #72 | Exceptional 21.7% |
| Immigrants | Venezuela | 99.0 /100 | #73 | Exceptional 21.8% |
| Cambodians | 99.0 /100 | #74 | Exceptional 21.8% |
| Mongolians | 99.0 /100 | #75 | Exceptional 21.8% |
| Greeks | 99.0 /100 | #76 | Exceptional 21.8% |
| Immigrants | Poland | 99.0 /100 | #77 | Exceptional 21.8% |