Immigrants from Caribbean vs Chinese Bachelor's Degree
COMPARE
Immigrants from Caribbean
Chinese
Bachelor's Degree
Bachelor's Degree Comparison
Immigrants from Caribbean
Chinese
31.4%
BACHELOR'S DEGREE
0.1/ 100
METRIC RATING
282nd/ 347
METRIC RANK
38.5%
BACHELOR'S DEGREE
66.6/ 100
METRIC RATING
159th/ 347
METRIC RANK
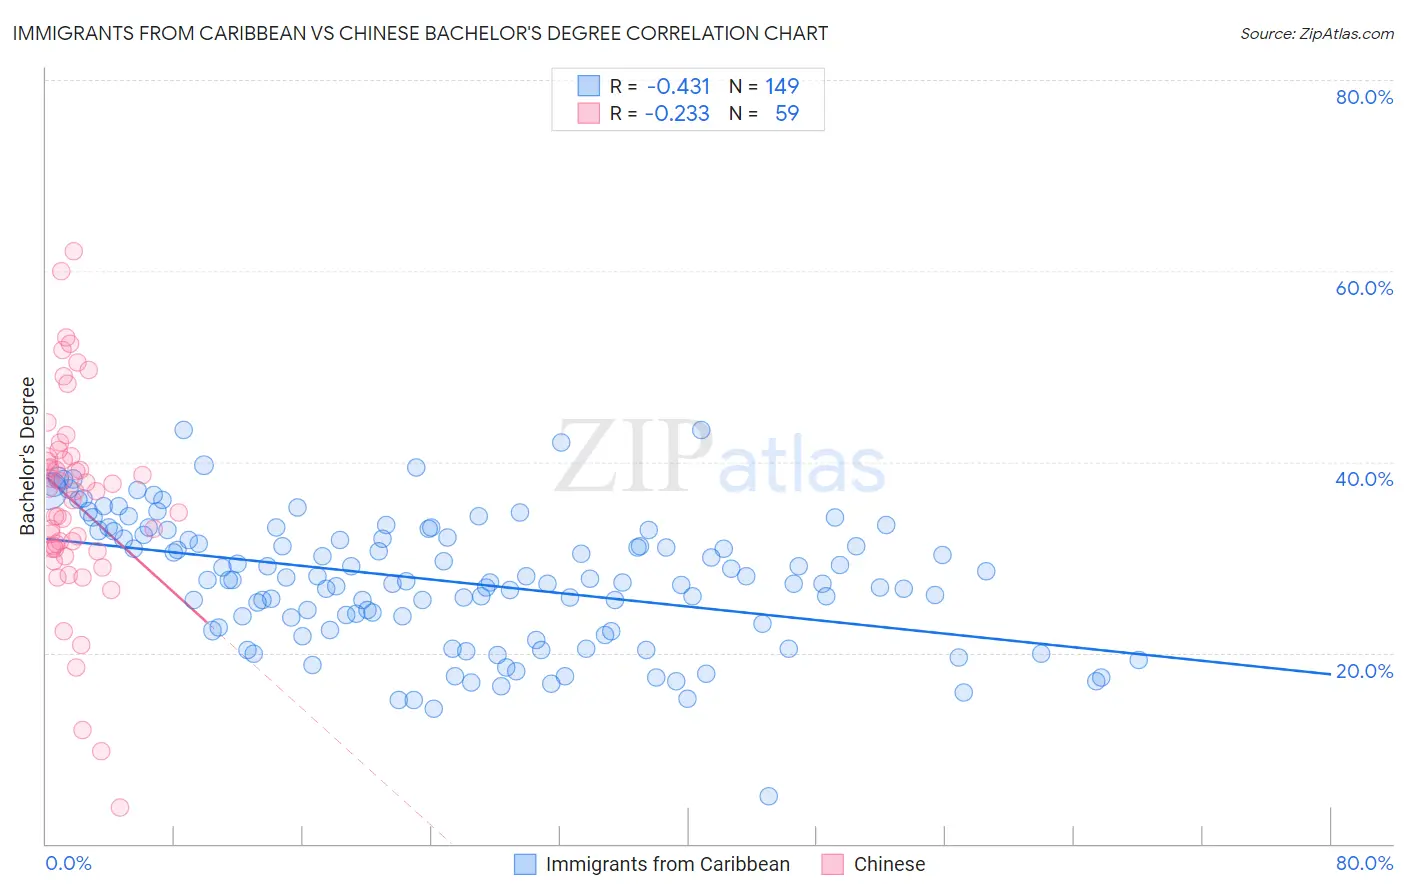
Immigrants from Caribbean vs Chinese Bachelor's Degree Correlation Chart
The statistical analysis conducted on geographies consisting of 450,021,690 people shows a moderate negative correlation between the proportion of Immigrants from Caribbean and percentage of population with at least bachelor's degree education in the United States with a correlation coefficient (R) of -0.431 and weighted average of 31.4%. Similarly, the statistical analysis conducted on geographies consisting of 64,809,883 people shows a weak negative correlation between the proportion of Chinese and percentage of population with at least bachelor's degree education in the United States with a correlation coefficient (R) of -0.233 and weighted average of 38.5%, a difference of 22.4%.
Bachelor's Degree Correlation Summary
| Measurement | Immigrants from Caribbean | Chinese |
| Minimum | 4.9% | 3.8% |
| Maximum | 43.4% | 62.0% |
| Range | 38.5% | 58.3% |
| Mean | 27.5% | 35.8% |
| Median | 27.6% | 36.9% |
| Interquartile 25% (IQ1) | 22.5% | 30.9% |
| Interquartile 75% (IQ3) | 32.6% | 40.3% |
| Interquartile Range (IQR) | 10.1% | 9.4% |
| Standard Deviation (Sample) | 6.8% | 10.8% |
| Standard Deviation (Population) | 6.8% | 10.7% |
Similar Demographics by Bachelor's Degree
Demographics Similar to Immigrants from Caribbean by Bachelor's Degree
In terms of bachelor's degree, the demographic groups most similar to Immigrants from Caribbean are Blackfeet (31.5%, a difference of 0.15%), Honduran (31.3%, a difference of 0.28%), Haitian (31.3%, a difference of 0.31%), Aleut (31.3%, a difference of 0.32%), and Immigrants from El Salvador (31.3%, a difference of 0.38%).
| Demographics | Rating | Rank | Bachelor's Degree |
| Samoans | 0.1 /100 | #275 | Tragic 31.8% |
| Salvadorans | 0.1 /100 | #276 | Tragic 31.8% |
| Dominicans | 0.1 /100 | #277 | Tragic 31.8% |
| Marshallese | 0.1 /100 | #278 | Tragic 31.7% |
| Hawaiians | 0.1 /100 | #279 | Tragic 31.6% |
| Immigrants | Laos | 0.1 /100 | #280 | Tragic 31.6% |
| Blackfeet | 0.1 /100 | #281 | Tragic 31.5% |
| Immigrants | Caribbean | 0.1 /100 | #282 | Tragic 31.4% |
| Hondurans | 0.1 /100 | #283 | Tragic 31.3% |
| Haitians | 0.1 /100 | #284 | Tragic 31.3% |
| Aleuts | 0.1 /100 | #285 | Tragic 31.3% |
| Immigrants | El Salvador | 0.1 /100 | #286 | Tragic 31.3% |
| Ottawa | 0.1 /100 | #287 | Tragic 31.1% |
| Guatemalans | 0.1 /100 | #288 | Tragic 31.0% |
| Puerto Ricans | 0.1 /100 | #289 | Tragic 31.0% |
Demographics Similar to Chinese by Bachelor's Degree
In terms of bachelor's degree, the demographic groups most similar to Chinese are Vietnamese (38.5%, a difference of 0.0%), Uruguayan (38.4%, a difference of 0.090%), Colombian (38.4%, a difference of 0.17%), Immigrants from Germany (38.6%, a difference of 0.33%), and Peruvian (38.3%, a difference of 0.34%).
| Demographics | Rating | Rank | Bachelor's Degree |
| Sudanese | 76.4 /100 | #152 | Good 38.9% |
| Slavs | 75.9 /100 | #153 | Good 38.9% |
| Canadians | 75.0 /100 | #154 | Good 38.8% |
| Immigrants | Kenya | 73.8 /100 | #155 | Good 38.8% |
| Kenyans | 72.5 /100 | #156 | Good 38.7% |
| Immigrants | South America | 70.1 /100 | #157 | Good 38.6% |
| Immigrants | Germany | 69.6 /100 | #158 | Good 38.6% |
| Chinese | 66.6 /100 | #159 | Good 38.5% |
| Vietnamese | 66.6 /100 | #160 | Good 38.5% |
| Uruguayans | 65.8 /100 | #161 | Good 38.4% |
| Colombians | 65.0 /100 | #162 | Good 38.4% |
| Peruvians | 63.4 /100 | #163 | Good 38.3% |
| Hungarians | 62.1 /100 | #164 | Good 38.3% |
| Sri Lankans | 59.1 /100 | #165 | Average 38.2% |
| Somalis | 58.6 /100 | #166 | Average 38.1% |