South African vs Ghanaian Disability Age Under 5
COMPARE
South African
Ghanaian
Disability Age Under 5
Disability Age Under 5 Comparison
South Africans
Ghanaians
1.1%
DISABILITY AGE UNDER 5
98.7/ 100
METRIC RATING
68th/ 347
METRIC RANK
1.2%
DISABILITY AGE UNDER 5
76.3/ 100
METRIC RATING
148th/ 347
METRIC RANK
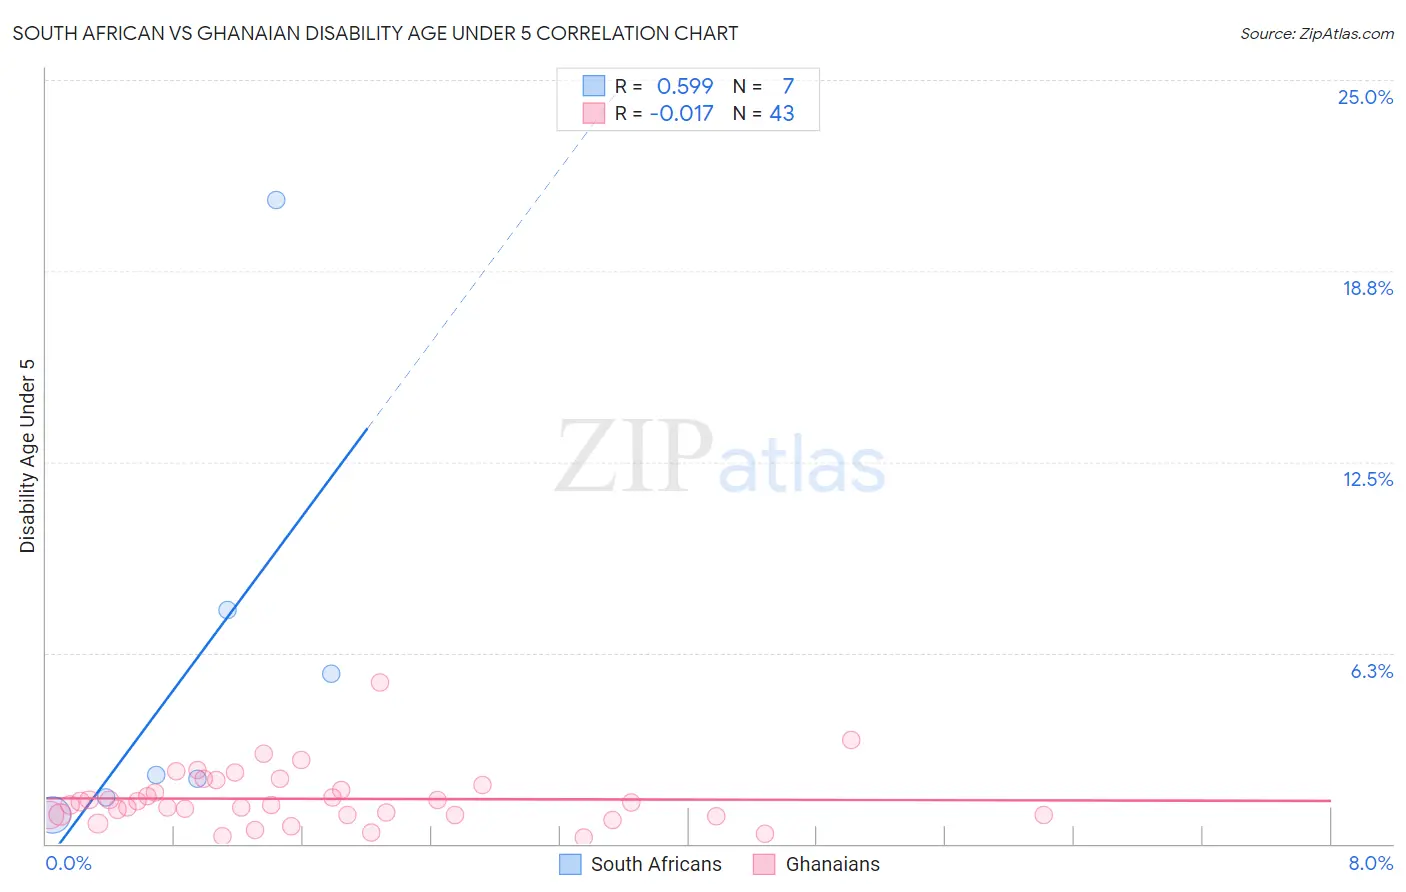
South African vs Ghanaian Disability Age Under 5 Correlation Chart
The statistical analysis conducted on geographies consisting of 120,529,150 people shows a substantial positive correlation between the proportion of South Africans and percentage of population with a disability under the age of 5 in the United States with a correlation coefficient (R) of 0.599 and weighted average of 1.1%. Similarly, the statistical analysis conducted on geographies consisting of 127,583,107 people shows no correlation between the proportion of Ghanaians and percentage of population with a disability under the age of 5 in the United States with a correlation coefficient (R) of -0.017 and weighted average of 1.2%, a difference of 7.9%.
Disability Age Under 5 Correlation Summary
| Measurement | South African | Ghanaian |
| Minimum | 0.96% | 0.20% |
| Maximum | 21.1% | 5.3% |
| Range | 20.1% | 5.1% |
| Mean | 5.9% | 1.5% |
| Median | 2.3% | 1.3% |
| Interquartile 25% (IQ1) | 1.5% | 0.94% |
| Interquartile 75% (IQ3) | 7.7% | 1.9% |
| Interquartile Range (IQR) | 6.1% | 0.97% |
| Standard Deviation (Sample) | 7.1% | 0.94% |
| Standard Deviation (Population) | 6.6% | 0.93% |
Similar Demographics by Disability Age Under 5
Demographics Similar to South Africans by Disability Age Under 5
In terms of disability age under 5, the demographic groups most similar to South Africans are Israeli (1.1%, a difference of 0.030%), Immigrants from Belize (1.1%, a difference of 0.040%), Immigrants from Indonesia (1.1%, a difference of 0.10%), Immigrants from Ecuador (1.1%, a difference of 0.11%), and Trinidadian and Tobagonian (1.1%, a difference of 0.17%).
| Demographics | Rating | Rank | Disability Age Under 5 |
| Immigrants | Ethiopia | 99.2 /100 | #61 | Exceptional 1.1% |
| Immigrants | Switzerland | 99.2 /100 | #62 | Exceptional 1.1% |
| Immigrants | Vietnam | 99.1 /100 | #63 | Exceptional 1.1% |
| Egyptians | 98.9 /100 | #64 | Exceptional 1.1% |
| Immigrants | Korea | 98.8 /100 | #65 | Exceptional 1.1% |
| Immigrants | Indonesia | 98.7 /100 | #66 | Exceptional 1.1% |
| Immigrants | Belize | 98.7 /100 | #67 | Exceptional 1.1% |
| South Africans | 98.7 /100 | #68 | Exceptional 1.1% |
| Israelis | 98.7 /100 | #69 | Exceptional 1.1% |
| Immigrants | Ecuador | 98.6 /100 | #70 | Exceptional 1.1% |
| Trinidadians and Tobagonians | 98.6 /100 | #71 | Exceptional 1.1% |
| Burmese | 98.5 /100 | #72 | Exceptional 1.1% |
| Immigrants | Sri Lanka | 98.5 /100 | #73 | Exceptional 1.1% |
| Jordanians | 98.5 /100 | #74 | Exceptional 1.1% |
| Immigrants | Pakistan | 98.4 /100 | #75 | Exceptional 1.1% |
Demographics Similar to Ghanaians by Disability Age Under 5
In terms of disability age under 5, the demographic groups most similar to Ghanaians are Icelander (1.2%, a difference of 0.010%), Kenyan (1.2%, a difference of 0.050%), South American (1.2%, a difference of 0.090%), Samoan (1.2%, a difference of 0.19%), and Yaqui (1.2%, a difference of 0.19%).
| Demographics | Rating | Rank | Disability Age Under 5 |
| Immigrants | Honduras | 80.4 /100 | #141 | Excellent 1.2% |
| Immigrants | Colombia | 79.3 /100 | #142 | Good 1.2% |
| Alsatians | 79.3 /100 | #143 | Good 1.2% |
| Immigrants | Middle Africa | 79.3 /100 | #144 | Good 1.2% |
| Immigrants | Zimbabwe | 77.9 /100 | #145 | Good 1.2% |
| Samoans | 77.7 /100 | #146 | Good 1.2% |
| Icelanders | 76.3 /100 | #147 | Good 1.2% |
| Ghanaians | 76.3 /100 | #148 | Good 1.2% |
| Kenyans | 75.9 /100 | #149 | Good 1.2% |
| South Americans | 75.6 /100 | #150 | Good 1.2% |
| Yaqui | 74.8 /100 | #151 | Good 1.2% |
| Hondurans | 72.5 /100 | #152 | Good 1.2% |
| Immigrants | Thailand | 69.4 /100 | #153 | Good 1.2% |
| Uruguayans | 68.8 /100 | #154 | Good 1.2% |
| Immigrants | Ghana | 68.7 /100 | #155 | Good 1.2% |