Immigrants from Turkey vs Ghanaian Disability Age Under 5
COMPARE
Immigrants from Turkey
Ghanaian
Disability Age Under 5
Disability Age Under 5 Comparison
Immigrants from Turkey
Ghanaians
1.1%
DISABILITY AGE UNDER 5
99.8/ 100
METRIC RATING
45th/ 347
METRIC RANK
1.2%
DISABILITY AGE UNDER 5
76.3/ 100
METRIC RATING
148th/ 347
METRIC RANK
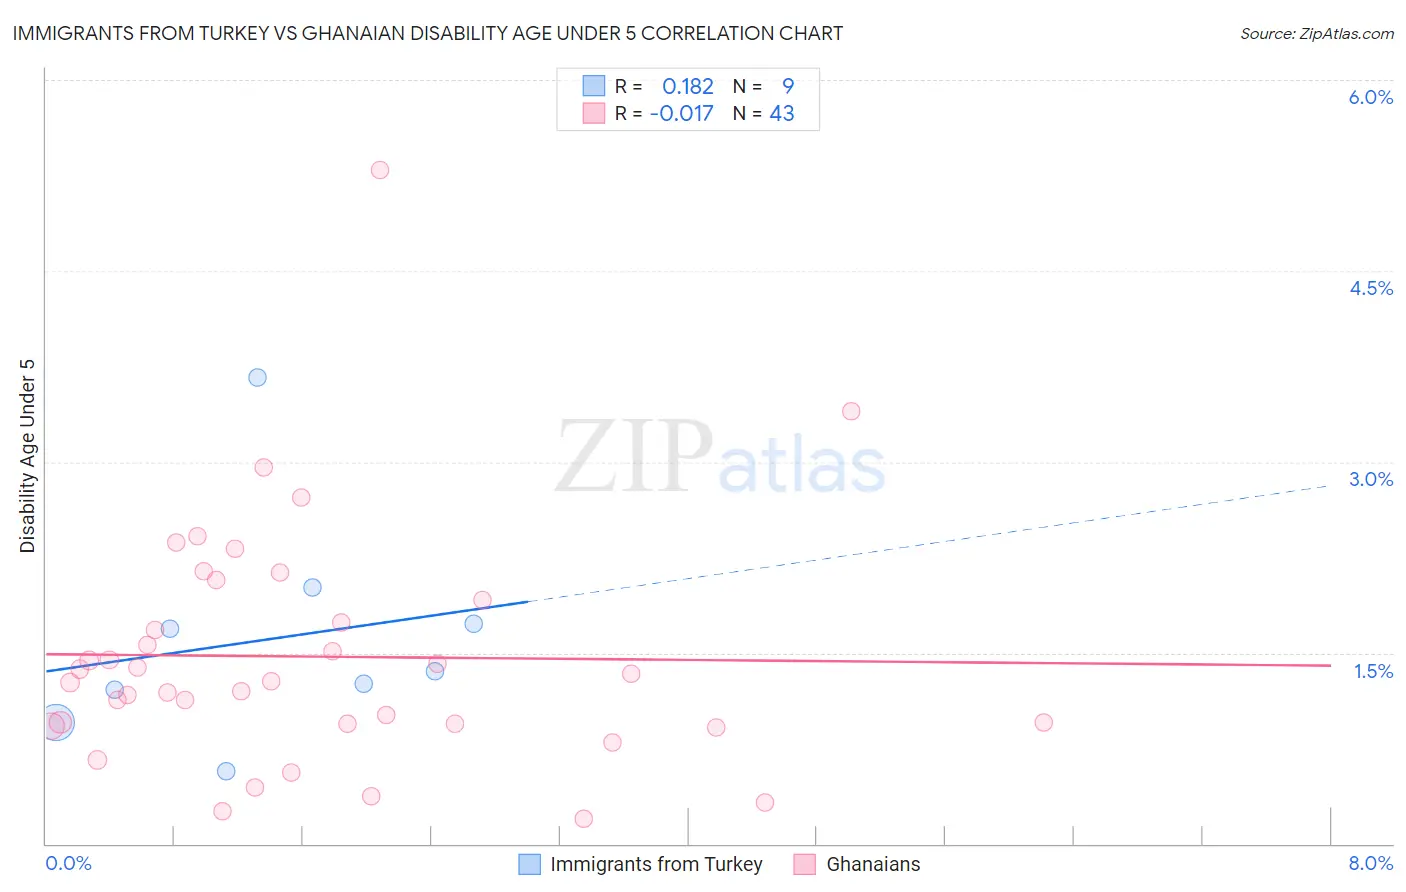
Immigrants from Turkey vs Ghanaian Disability Age Under 5 Correlation Chart
The statistical analysis conducted on geographies consisting of 138,836,268 people shows a poor positive correlation between the proportion of Immigrants from Turkey and percentage of population with a disability under the age of 5 in the United States with a correlation coefficient (R) of 0.182 and weighted average of 1.1%. Similarly, the statistical analysis conducted on geographies consisting of 127,583,107 people shows no correlation between the proportion of Ghanaians and percentage of population with a disability under the age of 5 in the United States with a correlation coefficient (R) of -0.017 and weighted average of 1.2%, a difference of 13.4%.
Disability Age Under 5 Correlation Summary
| Measurement | Immigrants from Turkey | Ghanaian |
| Minimum | 0.57% | 0.20% |
| Maximum | 3.7% | 5.3% |
| Range | 3.1% | 5.1% |
| Mean | 1.6% | 1.5% |
| Median | 1.4% | 1.3% |
| Interquartile 25% (IQ1) | 1.1% | 0.94% |
| Interquartile 75% (IQ3) | 1.9% | 1.9% |
| Interquartile Range (IQR) | 0.79% | 0.97% |
| Standard Deviation (Sample) | 0.89% | 0.94% |
| Standard Deviation (Population) | 0.83% | 0.93% |
Similar Demographics by Disability Age Under 5
Demographics Similar to Immigrants from Turkey by Disability Age Under 5
In terms of disability age under 5, the demographic groups most similar to Immigrants from Turkey are Immigrants from Asia (1.1%, a difference of 0.22%), Pima (1.1%, a difference of 0.32%), Immigrants from Bulgaria (1.1%, a difference of 0.33%), Immigrants from Congo (1.1%, a difference of 0.40%), and Thai (1.1%, a difference of 0.43%).
| Demographics | Rating | Rank | Disability Age Under 5 |
| Immigrants | Guyana | 99.9 /100 | #38 | Exceptional 1.0% |
| Filipinos | 99.9 /100 | #39 | Exceptional 1.1% |
| Immigrants | Albania | 99.9 /100 | #40 | Exceptional 1.1% |
| Thais | 99.8 /100 | #41 | Exceptional 1.1% |
| Immigrants | Bulgaria | 99.8 /100 | #42 | Exceptional 1.1% |
| Pima | 99.8 /100 | #43 | Exceptional 1.1% |
| Immigrants | Asia | 99.8 /100 | #44 | Exceptional 1.1% |
| Immigrants | Turkey | 99.8 /100 | #45 | Exceptional 1.1% |
| Immigrants | Congo | 99.8 /100 | #46 | Exceptional 1.1% |
| Immigrants | Sweden | 99.8 /100 | #47 | Exceptional 1.1% |
| Immigrants | Singapore | 99.7 /100 | #48 | Exceptional 1.1% |
| Immigrants | Russia | 99.7 /100 | #49 | Exceptional 1.1% |
| Immigrants | Japan | 99.7 /100 | #50 | Exceptional 1.1% |
| Immigrants | Kazakhstan | 99.7 /100 | #51 | Exceptional 1.1% |
| Immigrants | Bolivia | 99.6 /100 | #52 | Exceptional 1.1% |
Demographics Similar to Ghanaians by Disability Age Under 5
In terms of disability age under 5, the demographic groups most similar to Ghanaians are Icelander (1.2%, a difference of 0.010%), Kenyan (1.2%, a difference of 0.050%), South American (1.2%, a difference of 0.090%), Samoan (1.2%, a difference of 0.19%), and Yaqui (1.2%, a difference of 0.19%).
| Demographics | Rating | Rank | Disability Age Under 5 |
| Immigrants | Honduras | 80.4 /100 | #141 | Excellent 1.2% |
| Immigrants | Colombia | 79.3 /100 | #142 | Good 1.2% |
| Alsatians | 79.3 /100 | #143 | Good 1.2% |
| Immigrants | Middle Africa | 79.3 /100 | #144 | Good 1.2% |
| Immigrants | Zimbabwe | 77.9 /100 | #145 | Good 1.2% |
| Samoans | 77.7 /100 | #146 | Good 1.2% |
| Icelanders | 76.3 /100 | #147 | Good 1.2% |
| Ghanaians | 76.3 /100 | #148 | Good 1.2% |
| Kenyans | 75.9 /100 | #149 | Good 1.2% |
| South Americans | 75.6 /100 | #150 | Good 1.2% |
| Yaqui | 74.8 /100 | #151 | Good 1.2% |
| Hondurans | 72.5 /100 | #152 | Good 1.2% |
| Immigrants | Thailand | 69.4 /100 | #153 | Good 1.2% |
| Uruguayans | 68.8 /100 | #154 | Good 1.2% |
| Immigrants | Ghana | 68.7 /100 | #155 | Good 1.2% |