Immigrants from Cameroon vs Yakama Female Disability
COMPARE
Immigrants from Cameroon
Yakama
Female Disability
Female Disability Comparison
Immigrants from Cameroon
Yakama
11.6%
FEMALE DISABILITY
99.6/ 100
METRIC RATING
86th/ 347
METRIC RANK
13.2%
FEMALE DISABILITY
0.0/ 100
METRIC RATING
292nd/ 347
METRIC RANK
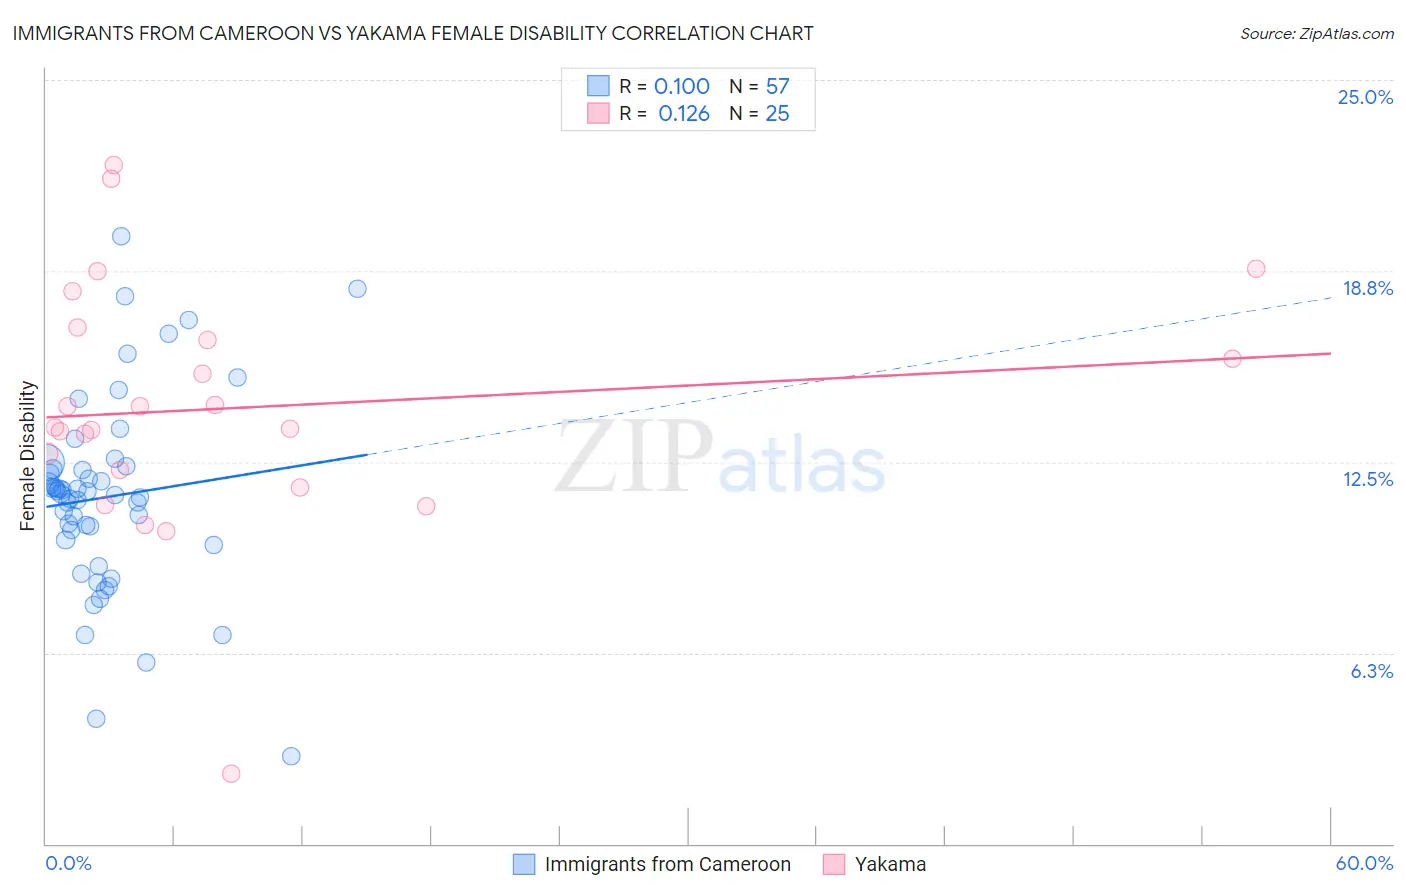
Immigrants from Cameroon vs Yakama Female Disability Correlation Chart
The statistical analysis conducted on geographies consisting of 130,749,562 people shows a poor positive correlation between the proportion of Immigrants from Cameroon and percentage of females with a disability in the United States with a correlation coefficient (R) of 0.100 and weighted average of 11.6%. Similarly, the statistical analysis conducted on geographies consisting of 19,917,587 people shows a poor positive correlation between the proportion of Yakama and percentage of females with a disability in the United States with a correlation coefficient (R) of 0.126 and weighted average of 13.2%, a difference of 14.4%.
Female Disability Correlation Summary
| Measurement | Immigrants from Cameroon | Yakama |
| Minimum | 2.9% | 2.3% |
| Maximum | 19.9% | 22.2% |
| Range | 17.0% | 19.9% |
| Mean | 11.4% | 14.3% |
| Median | 11.5% | 13.6% |
| Interquartile 25% (IQ1) | 9.9% | 12.0% |
| Interquartile 75% (IQ3) | 12.3% | 16.7% |
| Interquartile Range (IQR) | 2.5% | 4.7% |
| Standard Deviation (Sample) | 3.2% | 4.1% |
| Standard Deviation (Population) | 3.2% | 4.0% |
Similar Demographics by Female Disability
Demographics Similar to Immigrants from Cameroon by Female Disability
In terms of female disability, the demographic groups most similar to Immigrants from Cameroon are Palestinian (11.6%, a difference of 0.0%), Immigrants from Poland (11.6%, a difference of 0.040%), Immigrants from Serbia (11.6%, a difference of 0.070%), Immigrants from Denmark (11.6%, a difference of 0.070%), and Yup'ik (11.6%, a difference of 0.070%).
| Demographics | Rating | Rank | Female Disability |
| Sierra Leoneans | 99.7 /100 | #79 | Exceptional 11.5% |
| Immigrants | Jordan | 99.7 /100 | #80 | Exceptional 11.5% |
| Eastern Europeans | 99.7 /100 | #81 | Exceptional 11.5% |
| Luxembourgers | 99.6 /100 | #82 | Exceptional 11.6% |
| Immigrants | Serbia | 99.6 /100 | #83 | Exceptional 11.6% |
| Immigrants | Poland | 99.6 /100 | #84 | Exceptional 11.6% |
| Palestinians | 99.6 /100 | #85 | Exceptional 11.6% |
| Immigrants | Cameroon | 99.6 /100 | #86 | Exceptional 11.6% |
| Immigrants | Denmark | 99.5 /100 | #87 | Exceptional 11.6% |
| Yup'ik | 99.5 /100 | #88 | Exceptional 11.6% |
| Vietnamese | 99.5 /100 | #89 | Exceptional 11.6% |
| Immigrants | Romania | 99.5 /100 | #90 | Exceptional 11.6% |
| Immigrants | Zimbabwe | 99.5 /100 | #91 | Exceptional 11.6% |
| Immigrants | Czechoslovakia | 99.5 /100 | #92 | Exceptional 11.6% |
| Immigrants | Sierra Leone | 99.4 /100 | #93 | Exceptional 11.6% |
Demographics Similar to Yakama by Female Disability
In terms of female disability, the demographic groups most similar to Yakama are Shoshone (13.2%, a difference of 0.17%), Tlingit-Haida (13.2%, a difference of 0.23%), Immigrants from Yemen (13.2%, a difference of 0.23%), Marshallese (13.3%, a difference of 0.26%), and Celtic (13.3%, a difference of 0.31%).
| Demographics | Rating | Rank | Female Disability |
| Bangladeshis | 0.0 /100 | #285 | Tragic 13.1% |
| Fijians | 0.0 /100 | #286 | Tragic 13.1% |
| Yaqui | 0.0 /100 | #287 | Tragic 13.2% |
| Whites/Caucasians | 0.0 /100 | #288 | Tragic 13.2% |
| Tlingit-Haida | 0.0 /100 | #289 | Tragic 13.2% |
| Immigrants | Yemen | 0.0 /100 | #290 | Tragic 13.2% |
| Shoshone | 0.0 /100 | #291 | Tragic 13.2% |
| Yakama | 0.0 /100 | #292 | Tragic 13.2% |
| Marshallese | 0.0 /100 | #293 | Tragic 13.3% |
| Celtics | 0.0 /100 | #294 | Tragic 13.3% |
| French | 0.0 /100 | #295 | Tragic 13.3% |
| Nepalese | 0.0 /100 | #296 | Tragic 13.3% |
| Slovaks | 0.0 /100 | #297 | Tragic 13.3% |
| Immigrants | Nonimmigrants | 0.0 /100 | #298 | Tragic 13.4% |
| Immigrants | Dominican Republic | 0.0 /100 | #299 | Tragic 13.4% |