Immigrants from Cameroon vs Immigrants from Uruguay Female Disability
COMPARE
Immigrants from Cameroon
Immigrants from Uruguay
Female Disability
Female Disability Comparison
Immigrants from Cameroon
Immigrants from Uruguay
11.6%
FEMALE DISABILITY
99.6/ 100
METRIC RATING
86th/ 347
METRIC RANK
11.7%
FEMALE DISABILITY
98.5/ 100
METRIC RATING
100th/ 347
METRIC RANK
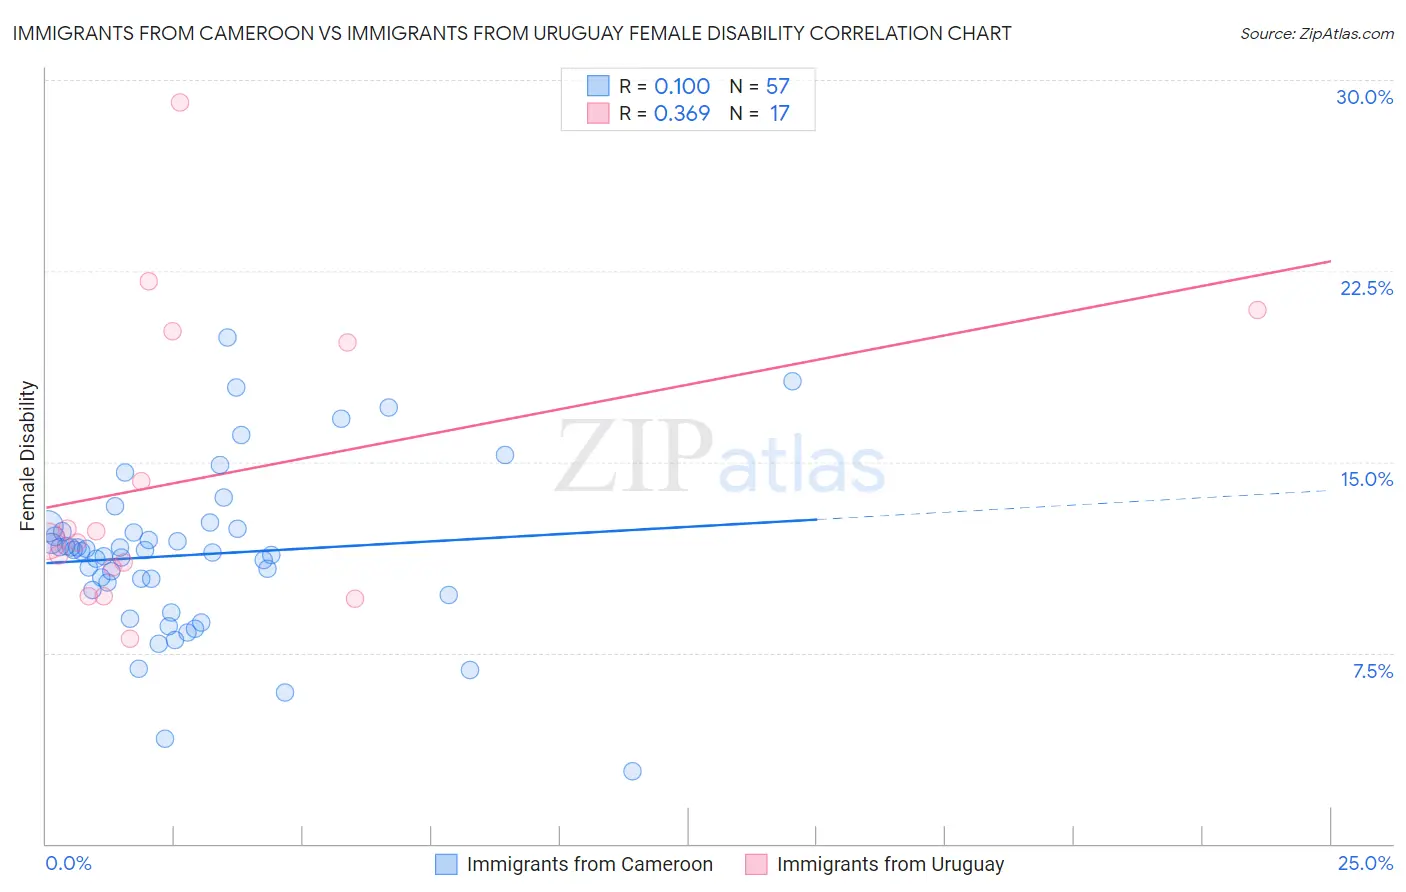
Immigrants from Cameroon vs Immigrants from Uruguay Female Disability Correlation Chart
The statistical analysis conducted on geographies consisting of 130,749,562 people shows a poor positive correlation between the proportion of Immigrants from Cameroon and percentage of females with a disability in the United States with a correlation coefficient (R) of 0.100 and weighted average of 11.6%. Similarly, the statistical analysis conducted on geographies consisting of 133,256,548 people shows a mild positive correlation between the proportion of Immigrants from Uruguay and percentage of females with a disability in the United States with a correlation coefficient (R) of 0.369 and weighted average of 11.7%, a difference of 1.3%.
Female Disability Correlation Summary
| Measurement | Immigrants from Cameroon | Immigrants from Uruguay |
| Minimum | 2.9% | 8.0% |
| Maximum | 19.9% | 29.1% |
| Range | 17.0% | 21.1% |
| Mean | 11.4% | 14.4% |
| Median | 11.5% | 11.9% |
| Interquartile 25% (IQ1) | 9.9% | 10.3% |
| Interquartile 75% (IQ3) | 12.3% | 19.9% |
| Interquartile Range (IQR) | 2.5% | 9.6% |
| Standard Deviation (Sample) | 3.2% | 5.8% |
| Standard Deviation (Population) | 3.2% | 5.6% |
Demographics Similar to Immigrants from Cameroon and Immigrants from Uruguay by Female Disability
In terms of female disability, the demographic groups most similar to Immigrants from Cameroon are Palestinian (11.6%, a difference of 0.0%), Immigrants from Poland (11.6%, a difference of 0.040%), Immigrants from Serbia (11.6%, a difference of 0.070%), Immigrants from Denmark (11.6%, a difference of 0.070%), and Yup'ik (11.6%, a difference of 0.070%). Similarly, the demographic groups most similar to Immigrants from Uruguay are Immigrants from Costa Rica (11.7%, a difference of 0.020%), Immigrants from South Eastern Asia (11.7%, a difference of 0.030%), Immigrants from Philippines (11.7%, a difference of 0.050%), Immigrants from Eastern Africa (11.7%, a difference of 0.10%), and Uruguayan (11.7%, a difference of 0.26%).
| Demographics | Rating | Rank | Female Disability |
| Immigrants | Serbia | 99.6 /100 | #83 | Exceptional 11.6% |
| Immigrants | Poland | 99.6 /100 | #84 | Exceptional 11.6% |
| Palestinians | 99.6 /100 | #85 | Exceptional 11.6% |
| Immigrants | Cameroon | 99.6 /100 | #86 | Exceptional 11.6% |
| Immigrants | Denmark | 99.5 /100 | #87 | Exceptional 11.6% |
| Yup'ik | 99.5 /100 | #88 | Exceptional 11.6% |
| Vietnamese | 99.5 /100 | #89 | Exceptional 11.6% |
| Immigrants | Romania | 99.5 /100 | #90 | Exceptional 11.6% |
| Immigrants | Zimbabwe | 99.5 /100 | #91 | Exceptional 11.6% |
| Immigrants | Czechoslovakia | 99.5 /100 | #92 | Exceptional 11.6% |
| Immigrants | Sierra Leone | 99.4 /100 | #93 | Exceptional 11.6% |
| Immigrants | Brazil | 99.4 /100 | #94 | Exceptional 11.6% |
| Immigrants | Northern Europe | 99.4 /100 | #95 | Exceptional 11.6% |
| Immigrants | Russia | 99.0 /100 | #96 | Exceptional 11.7% |
| Koreans | 99.0 /100 | #97 | Exceptional 11.7% |
| Uruguayans | 98.8 /100 | #98 | Exceptional 11.7% |
| Immigrants | Philippines | 98.6 /100 | #99 | Exceptional 11.7% |
| Immigrants | Uruguay | 98.5 /100 | #100 | Exceptional 11.7% |
| Immigrants | Costa Rica | 98.4 /100 | #101 | Exceptional 11.7% |
| Immigrants | South Eastern Asia | 98.4 /100 | #102 | Exceptional 11.7% |
| Immigrants | Eastern Africa | 98.3 /100 | #103 | Exceptional 11.7% |