Immigrants from Cameroon vs Immigrants from Zimbabwe Female Disability
COMPARE
Immigrants from Cameroon
Immigrants from Zimbabwe
Female Disability
Female Disability Comparison
Immigrants from Cameroon
Immigrants from Zimbabwe
11.6%
FEMALE DISABILITY
99.6/ 100
METRIC RATING
86th/ 347
METRIC RANK
11.6%
FEMALE DISABILITY
99.5/ 100
METRIC RATING
91st/ 347
METRIC RANK
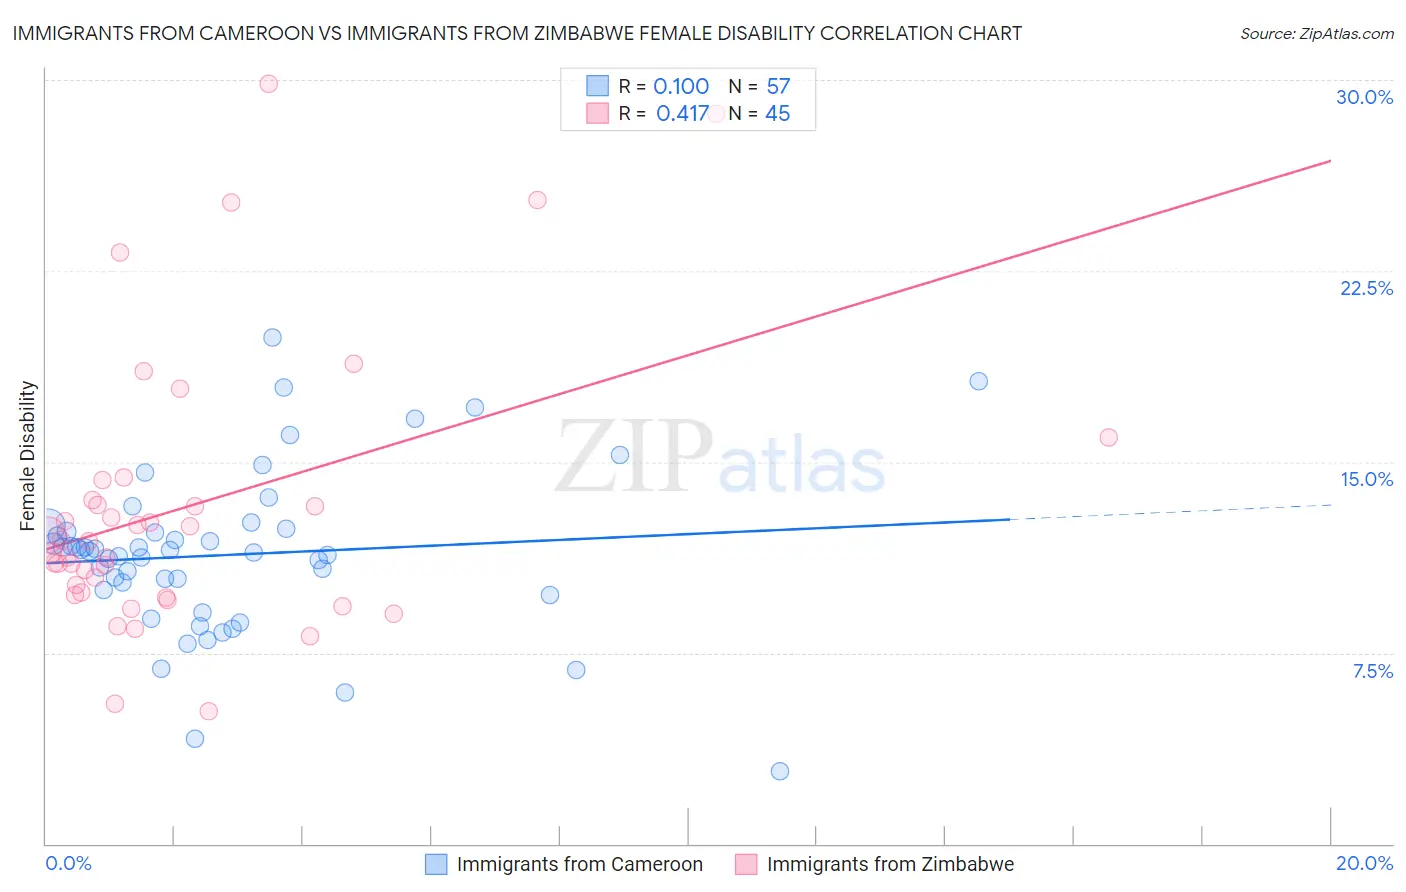
Immigrants from Cameroon vs Immigrants from Zimbabwe Female Disability Correlation Chart
The statistical analysis conducted on geographies consisting of 130,749,562 people shows a poor positive correlation between the proportion of Immigrants from Cameroon and percentage of females with a disability in the United States with a correlation coefficient (R) of 0.100 and weighted average of 11.6%. Similarly, the statistical analysis conducted on geographies consisting of 117,810,271 people shows a moderate positive correlation between the proportion of Immigrants from Zimbabwe and percentage of females with a disability in the United States with a correlation coefficient (R) of 0.417 and weighted average of 11.6%, a difference of 0.18%.
Female Disability Correlation Summary
| Measurement | Immigrants from Cameroon | Immigrants from Zimbabwe |
| Minimum | 2.9% | 5.2% |
| Maximum | 19.9% | 29.8% |
| Range | 17.0% | 24.6% |
| Mean | 11.4% | 13.2% |
| Median | 11.5% | 11.9% |
| Interquartile 25% (IQ1) | 9.9% | 9.8% |
| Interquartile 75% (IQ3) | 12.3% | 13.9% |
| Interquartile Range (IQR) | 2.5% | 4.0% |
| Standard Deviation (Sample) | 3.2% | 5.5% |
| Standard Deviation (Population) | 3.2% | 5.5% |
Demographics Similar to Immigrants from Cameroon and Immigrants from Zimbabwe by Female Disability
In terms of female disability, the demographic groups most similar to Immigrants from Cameroon are Palestinian (11.6%, a difference of 0.0%), Immigrants from Poland (11.6%, a difference of 0.040%), Immigrants from Serbia (11.6%, a difference of 0.070%), Immigrants from Denmark (11.6%, a difference of 0.070%), and Yup'ik (11.6%, a difference of 0.070%). Similarly, the demographic groups most similar to Immigrants from Zimbabwe are Vietnamese (11.6%, a difference of 0.010%), Immigrants from Romania (11.6%, a difference of 0.010%), Immigrants from Czechoslovakia (11.6%, a difference of 0.010%), Immigrants from Denmark (11.6%, a difference of 0.11%), and Yup'ik (11.6%, a difference of 0.11%).
| Demographics | Rating | Rank | Female Disability |
| Immigrants | South Africa | 99.7 /100 | #78 | Exceptional 11.5% |
| Sierra Leoneans | 99.7 /100 | #79 | Exceptional 11.5% |
| Immigrants | Jordan | 99.7 /100 | #80 | Exceptional 11.5% |
| Eastern Europeans | 99.7 /100 | #81 | Exceptional 11.5% |
| Luxembourgers | 99.6 /100 | #82 | Exceptional 11.6% |
| Immigrants | Serbia | 99.6 /100 | #83 | Exceptional 11.6% |
| Immigrants | Poland | 99.6 /100 | #84 | Exceptional 11.6% |
| Palestinians | 99.6 /100 | #85 | Exceptional 11.6% |
| Immigrants | Cameroon | 99.6 /100 | #86 | Exceptional 11.6% |
| Immigrants | Denmark | 99.5 /100 | #87 | Exceptional 11.6% |
| Yup'ik | 99.5 /100 | #88 | Exceptional 11.6% |
| Vietnamese | 99.5 /100 | #89 | Exceptional 11.6% |
| Immigrants | Romania | 99.5 /100 | #90 | Exceptional 11.6% |
| Immigrants | Zimbabwe | 99.5 /100 | #91 | Exceptional 11.6% |
| Immigrants | Czechoslovakia | 99.5 /100 | #92 | Exceptional 11.6% |
| Immigrants | Sierra Leone | 99.4 /100 | #93 | Exceptional 11.6% |
| Immigrants | Brazil | 99.4 /100 | #94 | Exceptional 11.6% |
| Immigrants | Northern Europe | 99.4 /100 | #95 | Exceptional 11.6% |
| Immigrants | Russia | 99.0 /100 | #96 | Exceptional 11.7% |
| Koreans | 99.0 /100 | #97 | Exceptional 11.7% |
| Uruguayans | 98.8 /100 | #98 | Exceptional 11.7% |