Navajo vs Yakama Female Disability
COMPARE
Navajo
Yakama
Female Disability
Female Disability Comparison
Navajo
Yakama
14.2%
FEMALE DISABILITY
0.0/ 100
METRIC RATING
325th/ 347
METRIC RANK
13.2%
FEMALE DISABILITY
0.0/ 100
METRIC RATING
292nd/ 347
METRIC RANK
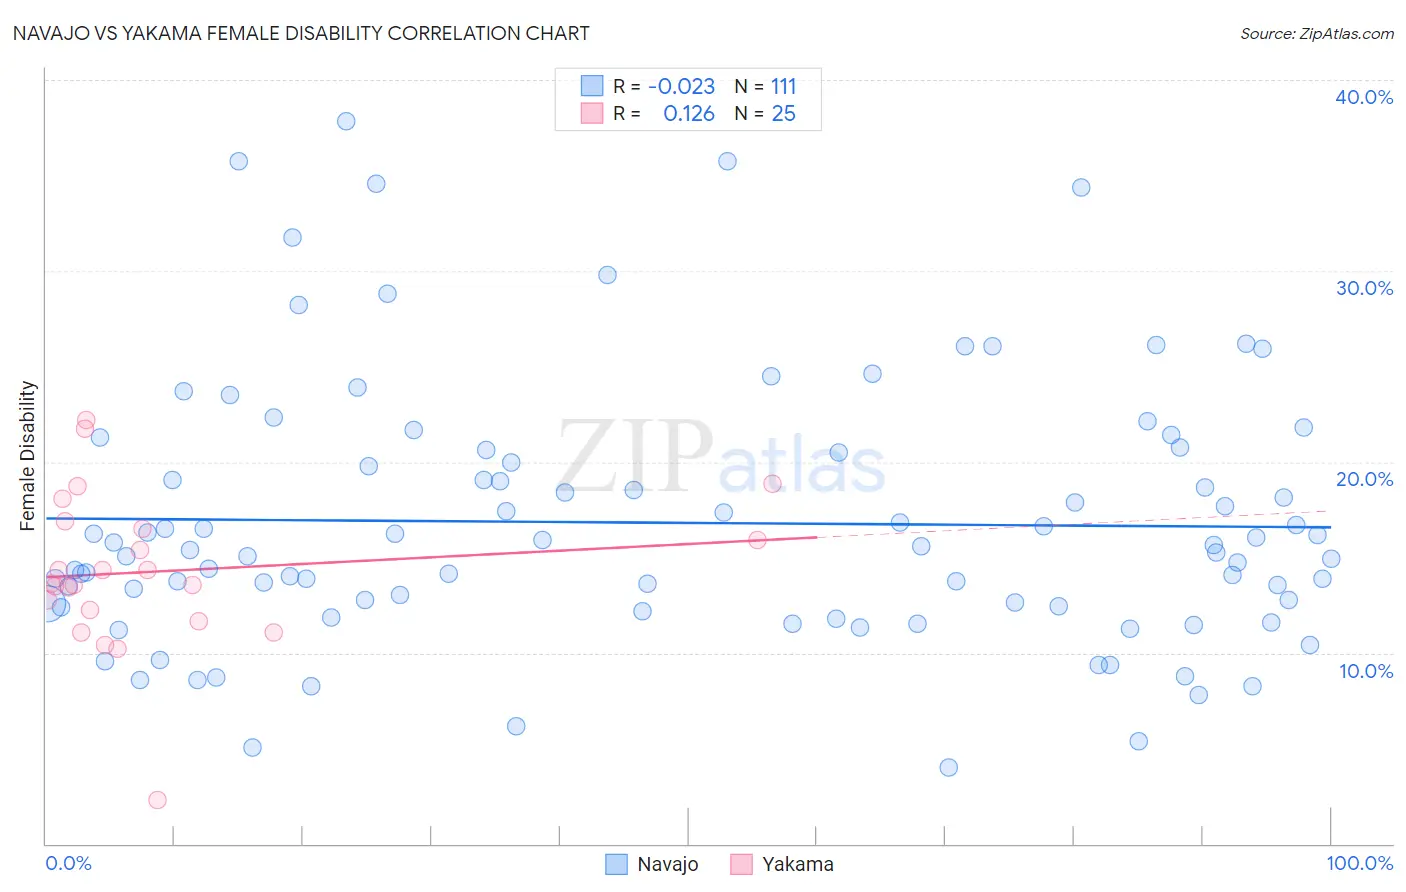
Navajo vs Yakama Female Disability Correlation Chart
The statistical analysis conducted on geographies consisting of 224,768,780 people shows no correlation between the proportion of Navajo and percentage of females with a disability in the United States with a correlation coefficient (R) of -0.023 and weighted average of 14.2%. Similarly, the statistical analysis conducted on geographies consisting of 19,917,587 people shows a poor positive correlation between the proportion of Yakama and percentage of females with a disability in the United States with a correlation coefficient (R) of 0.126 and weighted average of 13.2%, a difference of 7.0%.
Female Disability Correlation Summary
| Measurement | Navajo | Yakama |
| Minimum | 4.0% | 2.3% |
| Maximum | 37.8% | 22.2% |
| Range | 33.8% | 19.9% |
| Mean | 16.8% | 14.3% |
| Median | 15.4% | 13.6% |
| Interquartile 25% (IQ1) | 12.5% | 12.0% |
| Interquartile 75% (IQ3) | 20.5% | 16.7% |
| Interquartile Range (IQR) | 8.0% | 4.7% |
| Standard Deviation (Sample) | 6.9% | 4.1% |
| Standard Deviation (Population) | 6.9% | 4.0% |
Similar Demographics by Female Disability
Demographics Similar to Navajo by Female Disability
In terms of female disability, the demographic groups most similar to Navajo are Comanche (14.2%, a difference of 0.11%), Native/Alaskan (14.1%, a difference of 0.14%), Black/African American (14.1%, a difference of 0.16%), Pueblo (14.1%, a difference of 0.32%), and Potawatomi (14.1%, a difference of 0.33%).
| Demographics | Rating | Rank | Female Disability |
| Paiute | 0.0 /100 | #318 | Tragic 14.0% |
| Iroquois | 0.0 /100 | #319 | Tragic 14.0% |
| Americans | 0.0 /100 | #320 | Tragic 14.1% |
| Potawatomi | 0.0 /100 | #321 | Tragic 14.1% |
| Pueblo | 0.0 /100 | #322 | Tragic 14.1% |
| Blacks/African Americans | 0.0 /100 | #323 | Tragic 14.1% |
| Natives/Alaskans | 0.0 /100 | #324 | Tragic 14.1% |
| Navajo | 0.0 /100 | #325 | Tragic 14.2% |
| Comanche | 0.0 /100 | #326 | Tragic 14.2% |
| Ottawa | 0.0 /100 | #327 | Tragic 14.2% |
| Cape Verdeans | 0.0 /100 | #328 | Tragic 14.2% |
| Osage | 0.0 /100 | #329 | Tragic 14.3% |
| Yuman | 0.0 /100 | #330 | Tragic 14.5% |
| Immigrants | Cabo Verde | 0.0 /100 | #331 | Tragic 14.6% |
| Pima | 0.0 /100 | #332 | Tragic 14.8% |
Demographics Similar to Yakama by Female Disability
In terms of female disability, the demographic groups most similar to Yakama are Shoshone (13.2%, a difference of 0.17%), Tlingit-Haida (13.2%, a difference of 0.23%), Immigrants from Yemen (13.2%, a difference of 0.23%), Marshallese (13.3%, a difference of 0.26%), and Celtic (13.3%, a difference of 0.31%).
| Demographics | Rating | Rank | Female Disability |
| Bangladeshis | 0.0 /100 | #285 | Tragic 13.1% |
| Fijians | 0.0 /100 | #286 | Tragic 13.1% |
| Yaqui | 0.0 /100 | #287 | Tragic 13.2% |
| Whites/Caucasians | 0.0 /100 | #288 | Tragic 13.2% |
| Tlingit-Haida | 0.0 /100 | #289 | Tragic 13.2% |
| Immigrants | Yemen | 0.0 /100 | #290 | Tragic 13.2% |
| Shoshone | 0.0 /100 | #291 | Tragic 13.2% |
| Yakama | 0.0 /100 | #292 | Tragic 13.2% |
| Marshallese | 0.0 /100 | #293 | Tragic 13.3% |
| Celtics | 0.0 /100 | #294 | Tragic 13.3% |
| French | 0.0 /100 | #295 | Tragic 13.3% |
| Nepalese | 0.0 /100 | #296 | Tragic 13.3% |
| Slovaks | 0.0 /100 | #297 | Tragic 13.3% |
| Immigrants | Nonimmigrants | 0.0 /100 | #298 | Tragic 13.4% |
| Immigrants | Dominican Republic | 0.0 /100 | #299 | Tragic 13.4% |