Immigrants from Cameroon vs Pima Female Disability
COMPARE
Immigrants from Cameroon
Pima
Female Disability
Female Disability Comparison
Immigrants from Cameroon
Pima
11.6%
FEMALE DISABILITY
99.6/ 100
METRIC RATING
86th/ 347
METRIC RANK
14.8%
FEMALE DISABILITY
0.0/ 100
METRIC RATING
332nd/ 347
METRIC RANK
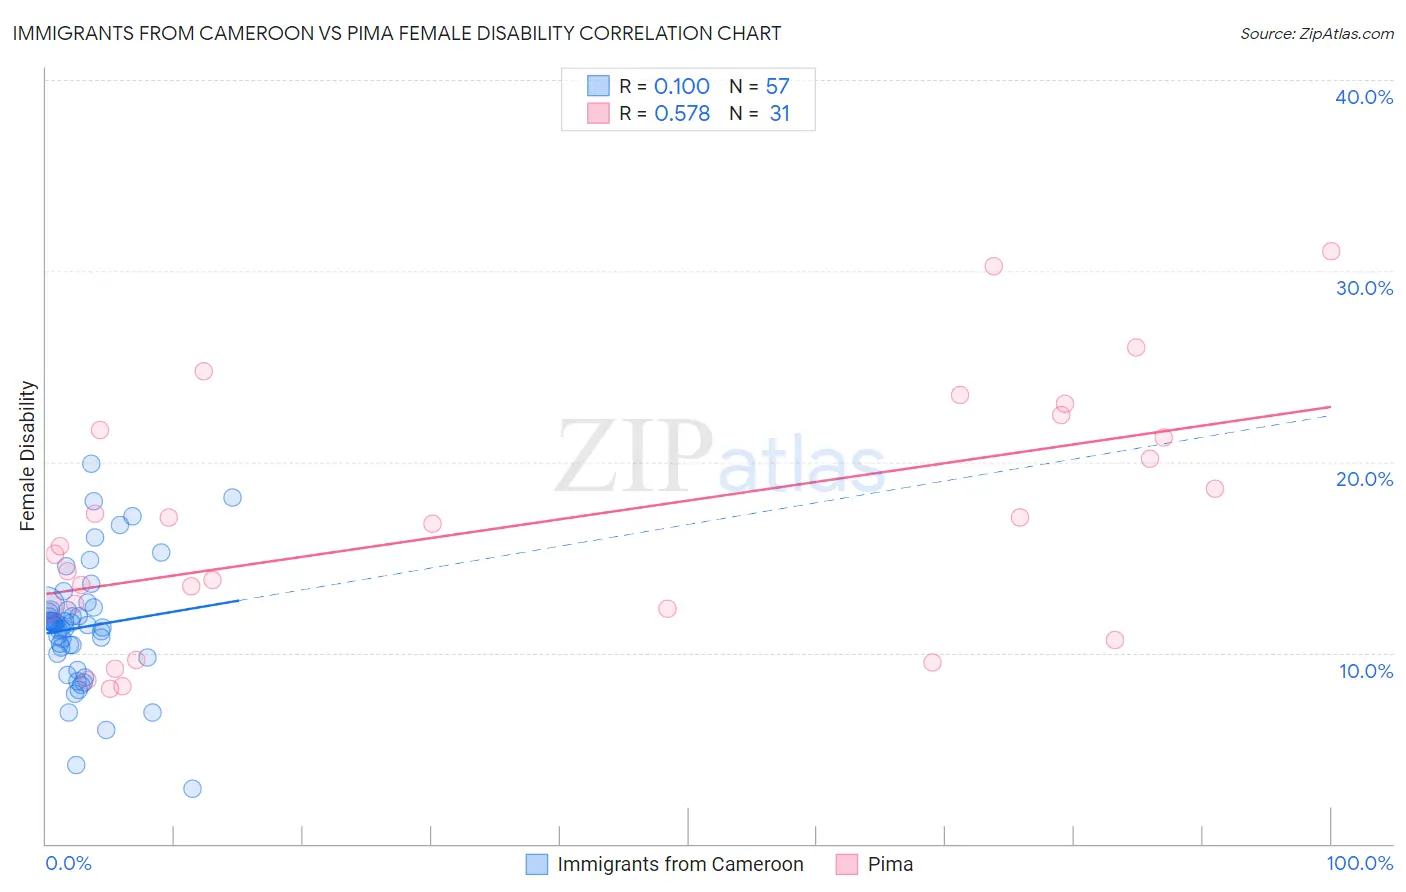
Immigrants from Cameroon vs Pima Female Disability Correlation Chart
The statistical analysis conducted on geographies consisting of 130,749,562 people shows a poor positive correlation between the proportion of Immigrants from Cameroon and percentage of females with a disability in the United States with a correlation coefficient (R) of 0.100 and weighted average of 11.6%. Similarly, the statistical analysis conducted on geographies consisting of 61,537,754 people shows a substantial positive correlation between the proportion of Pima and percentage of females with a disability in the United States with a correlation coefficient (R) of 0.578 and weighted average of 14.8%, a difference of 27.9%.
Female Disability Correlation Summary
| Measurement | Immigrants from Cameroon | Pima |
| Minimum | 2.9% | 8.1% |
| Maximum | 19.9% | 31.0% |
| Range | 17.0% | 22.9% |
| Mean | 11.4% | 16.7% |
| Median | 11.5% | 15.6% |
| Interquartile 25% (IQ1) | 9.9% | 12.3% |
| Interquartile 75% (IQ3) | 12.3% | 21.6% |
| Interquartile Range (IQR) | 2.5% | 9.3% |
| Standard Deviation (Sample) | 3.2% | 6.4% |
| Standard Deviation (Population) | 3.2% | 6.3% |
Similar Demographics by Female Disability
Demographics Similar to Immigrants from Cameroon by Female Disability
In terms of female disability, the demographic groups most similar to Immigrants from Cameroon are Palestinian (11.6%, a difference of 0.0%), Immigrants from Poland (11.6%, a difference of 0.040%), Immigrants from Serbia (11.6%, a difference of 0.070%), Immigrants from Denmark (11.6%, a difference of 0.070%), and Yup'ik (11.6%, a difference of 0.070%).
| Demographics | Rating | Rank | Female Disability |
| Sierra Leoneans | 99.7 /100 | #79 | Exceptional 11.5% |
| Immigrants | Jordan | 99.7 /100 | #80 | Exceptional 11.5% |
| Eastern Europeans | 99.7 /100 | #81 | Exceptional 11.5% |
| Luxembourgers | 99.6 /100 | #82 | Exceptional 11.6% |
| Immigrants | Serbia | 99.6 /100 | #83 | Exceptional 11.6% |
| Immigrants | Poland | 99.6 /100 | #84 | Exceptional 11.6% |
| Palestinians | 99.6 /100 | #85 | Exceptional 11.6% |
| Immigrants | Cameroon | 99.6 /100 | #86 | Exceptional 11.6% |
| Immigrants | Denmark | 99.5 /100 | #87 | Exceptional 11.6% |
| Yup'ik | 99.5 /100 | #88 | Exceptional 11.6% |
| Vietnamese | 99.5 /100 | #89 | Exceptional 11.6% |
| Immigrants | Romania | 99.5 /100 | #90 | Exceptional 11.6% |
| Immigrants | Zimbabwe | 99.5 /100 | #91 | Exceptional 11.6% |
| Immigrants | Czechoslovakia | 99.5 /100 | #92 | Exceptional 11.6% |
| Immigrants | Sierra Leone | 99.4 /100 | #93 | Exceptional 11.6% |
Demographics Similar to Pima by Female Disability
In terms of female disability, the demographic groups most similar to Pima are Immigrants from the Azores (14.9%, a difference of 0.39%), Cherokee (14.9%, a difference of 0.48%), Cajun (14.9%, a difference of 0.50%), Seminole (15.0%, a difference of 1.2%), and Tohono O'odham (15.0%, a difference of 1.3%).
| Demographics | Rating | Rank | Female Disability |
| Navajo | 0.0 /100 | #325 | Tragic 14.2% |
| Comanche | 0.0 /100 | #326 | Tragic 14.2% |
| Ottawa | 0.0 /100 | #327 | Tragic 14.2% |
| Cape Verdeans | 0.0 /100 | #328 | Tragic 14.2% |
| Osage | 0.0 /100 | #329 | Tragic 14.3% |
| Yuman | 0.0 /100 | #330 | Tragic 14.5% |
| Immigrants | Cabo Verde | 0.0 /100 | #331 | Tragic 14.6% |
| Pima | 0.0 /100 | #332 | Tragic 14.8% |
| Immigrants | Azores | 0.0 /100 | #333 | Tragic 14.9% |
| Cherokee | 0.0 /100 | #334 | Tragic 14.9% |
| Cajuns | 0.0 /100 | #335 | Tragic 14.9% |
| Seminole | 0.0 /100 | #336 | Tragic 15.0% |
| Tohono O'odham | 0.0 /100 | #337 | Tragic 15.0% |
| Dutch West Indians | 0.0 /100 | #338 | Tragic 15.0% |
| Colville | 0.0 /100 | #339 | Tragic 15.1% |