Immigrants from Cabo Verde vs Pueblo Unemployment Among Ages 25 to 29 years
COMPARE
Immigrants from Cabo Verde
Pueblo
Unemployment Among Ages 25 to 29 years
Unemployment Among Ages 25 to 29 years Comparison
Immigrants from Cabo Verde
Pueblo
6.8%
UNEMPLOYMENT AMONG AGES 25 TO 29 YEARS
16.2/ 100
METRIC RATING
212th/ 347
METRIC RANK
10.4%
UNEMPLOYMENT AMONG AGES 25 TO 29 YEARS
0.0/ 100
METRIC RATING
332nd/ 347
METRIC RANK
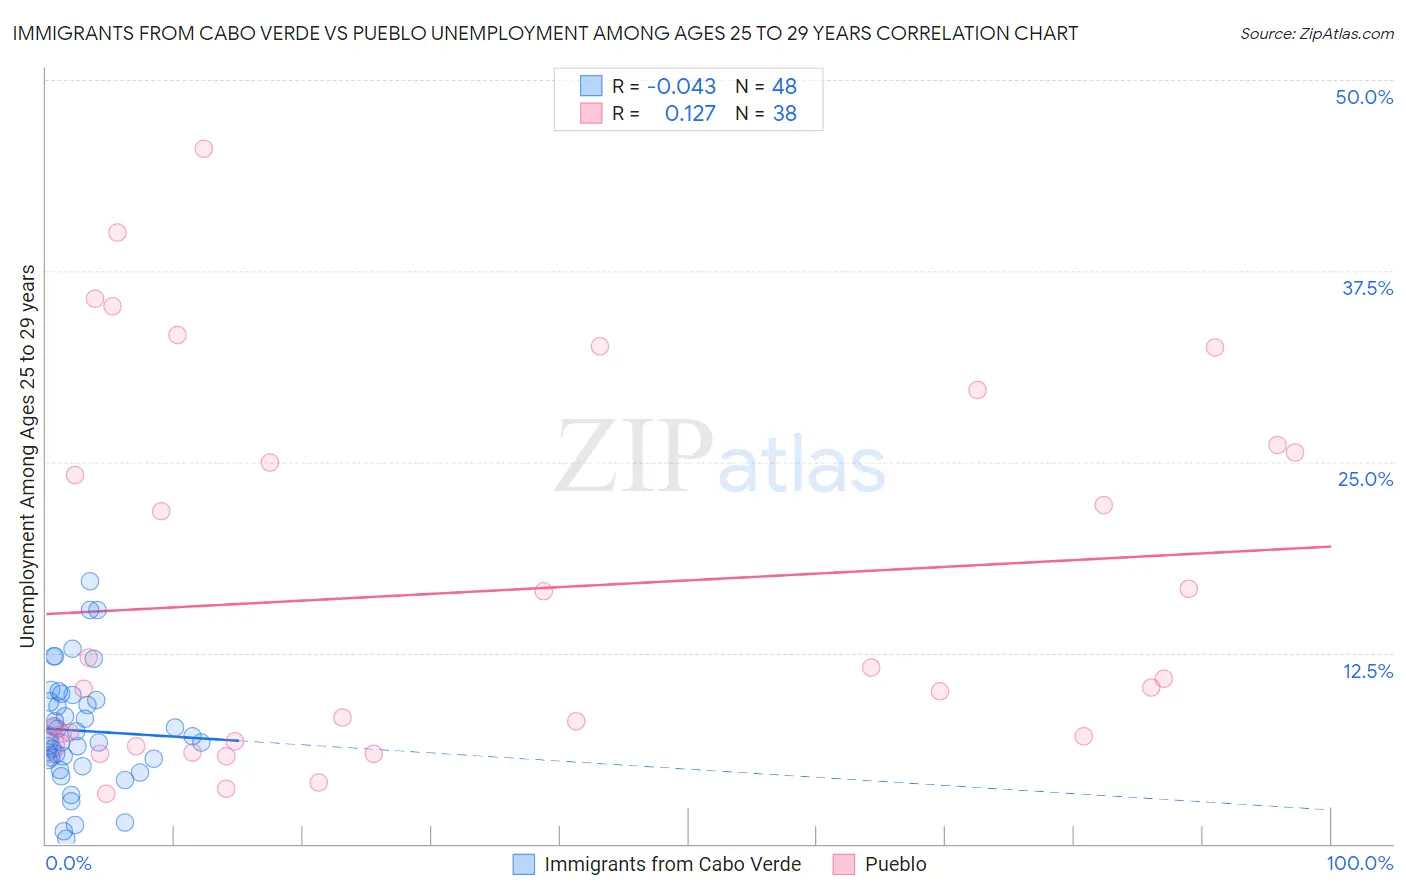
Immigrants from Cabo Verde vs Pueblo Unemployment Among Ages 25 to 29 years Correlation Chart
The statistical analysis conducted on geographies consisting of 37,701,958 people shows no correlation between the proportion of Immigrants from Cabo Verde and unemployment rate among population between the ages 25 and 29 in the United States with a correlation coefficient (R) of -0.043 and weighted average of 6.8%. Similarly, the statistical analysis conducted on geographies consisting of 118,019,548 people shows a poor positive correlation between the proportion of Pueblo and unemployment rate among population between the ages 25 and 29 in the United States with a correlation coefficient (R) of 0.127 and weighted average of 10.4%, a difference of 53.0%.
Unemployment Among Ages 25 to 29 years Correlation Summary
| Measurement | Immigrants from Cabo Verde | Pueblo |
| Minimum | 0.30% | 3.2% |
| Maximum | 17.2% | 45.5% |
| Range | 16.9% | 42.3% |
| Mean | 7.4% | 16.5% |
| Median | 6.9% | 10.5% |
| Interquartile 25% (IQ1) | 5.6% | 6.7% |
| Interquartile 75% (IQ3) | 9.3% | 25.6% |
| Interquartile Range (IQR) | 3.8% | 18.9% |
| Standard Deviation (Sample) | 3.7% | 12.1% |
| Standard Deviation (Population) | 3.6% | 11.9% |
Similar Demographics by Unemployment Among Ages 25 to 29 years
Demographics Similar to Immigrants from Cabo Verde by Unemployment Among Ages 25 to 29 years
In terms of unemployment among ages 25 to 29 years, the demographic groups most similar to Immigrants from Cabo Verde are Immigrants from Philippines (6.8%, a difference of 0.050%), Canadian (6.8%, a difference of 0.080%), Hawaiian (6.8%, a difference of 0.10%), Immigrants from Syria (6.8%, a difference of 0.12%), and Liberian (6.8%, a difference of 0.17%).
| Demographics | Rating | Rank | Unemployment Among Ages 25 to 29 years |
| Immigrants | England | 19.8 /100 | #205 | Poor 6.8% |
| Ugandans | 19.8 /100 | #206 | Poor 6.8% |
| Immigrants | Denmark | 19.0 /100 | #207 | Poor 6.8% |
| Immigrants | Germany | 18.8 /100 | #208 | Poor 6.8% |
| Hawaiians | 17.1 /100 | #209 | Poor 6.8% |
| Canadians | 16.9 /100 | #210 | Poor 6.8% |
| Immigrants | Philippines | 16.7 /100 | #211 | Poor 6.8% |
| Immigrants | Cabo Verde | 16.2 /100 | #212 | Poor 6.8% |
| Immigrants | Syria | 15.1 /100 | #213 | Poor 6.8% |
| Liberians | 14.7 /100 | #214 | Poor 6.8% |
| Spanish | 14.4 /100 | #215 | Poor 6.8% |
| Slovaks | 14.3 /100 | #216 | Poor 6.8% |
| Ute | 13.4 /100 | #217 | Poor 6.8% |
| Immigrants | Austria | 12.3 /100 | #218 | Poor 6.8% |
| Whites/Caucasians | 10.6 /100 | #219 | Poor 6.9% |
Demographics Similar to Pueblo by Unemployment Among Ages 25 to 29 years
In terms of unemployment among ages 25 to 29 years, the demographic groups most similar to Pueblo are Alaska Native (10.2%, a difference of 2.3%), Alaskan Athabascan (10.8%, a difference of 3.4%), Yuman (11.0%, a difference of 5.4%), Native/Alaskan (9.8%, a difference of 6.1%), and Puerto Rican (11.1%, a difference of 6.6%).
| Demographics | Rating | Rank | Unemployment Among Ages 25 to 29 years |
| Yakama | 0.0 /100 | #325 | Tragic 8.8% |
| Shoshone | 0.0 /100 | #326 | Tragic 9.2% |
| Colville | 0.0 /100 | #327 | Tragic 9.2% |
| Apache | 0.0 /100 | #328 | Tragic 9.5% |
| Aleuts | 0.0 /100 | #329 | Tragic 9.7% |
| Natives/Alaskans | 0.0 /100 | #330 | Tragic 9.8% |
| Alaska Natives | 0.0 /100 | #331 | Tragic 10.2% |
| Pueblo | 0.0 /100 | #332 | Tragic 10.4% |
| Alaskan Athabascans | 0.0 /100 | #333 | Tragic 10.8% |
| Yuman | 0.0 /100 | #334 | Tragic 11.0% |
| Puerto Ricans | 0.0 /100 | #335 | Tragic 11.1% |
| Lumbee | 0.0 /100 | #336 | Tragic 11.2% |
| Menominee | 0.0 /100 | #337 | Tragic 11.3% |
| Sioux | 0.0 /100 | #338 | Tragic 11.7% |
| Pima | 0.0 /100 | #339 | Tragic 11.8% |