Immigrants from Cabo Verde vs Pueblo Female Poverty Among 18-24 Year Olds
COMPARE
Immigrants from Cabo Verde
Pueblo
Female Poverty Among 18-24 Year Olds
Female Poverty Among 18-24 Year Olds Comparison
Immigrants from Cabo Verde
Pueblo
19.0%
FEMALE POVERTY AMONG 18-24 YEAR OLDS
99.0/ 100
METRIC RATING
89th/ 347
METRIC RANK
26.9%
FEMALE POVERTY AMONG 18-24 YEAR OLDS
0.0/ 100
METRIC RATING
334th/ 347
METRIC RANK
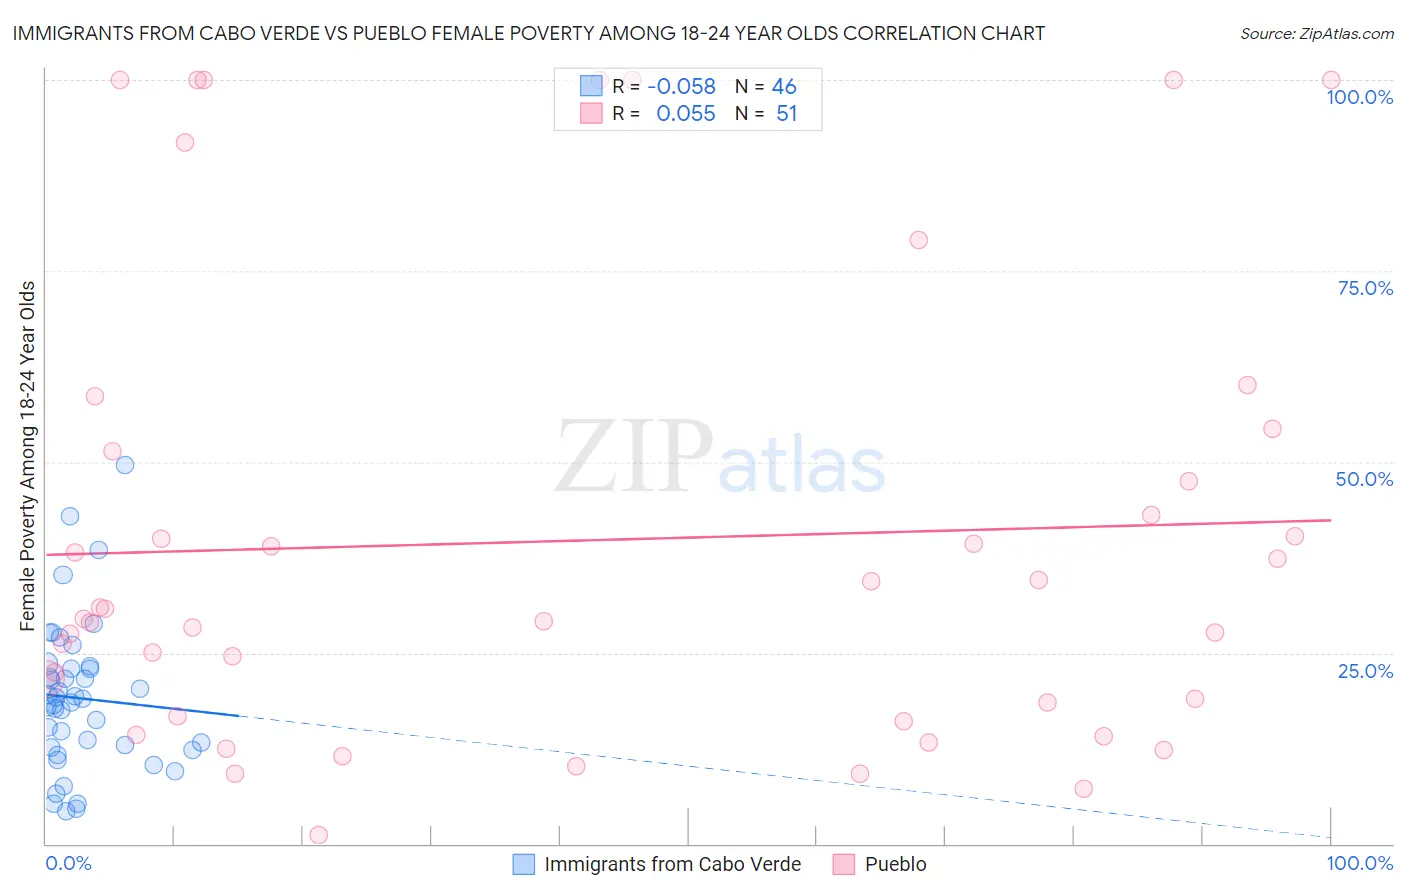
Immigrants from Cabo Verde vs Pueblo Female Poverty Among 18-24 Year Olds Correlation Chart
The statistical analysis conducted on geographies consisting of 37,707,106 people shows a slight negative correlation between the proportion of Immigrants from Cabo Verde and poverty level among females between the ages 18 and 24 in the United States with a correlation coefficient (R) of -0.058 and weighted average of 19.0%. Similarly, the statistical analysis conducted on geographies consisting of 119,346,276 people shows a slight positive correlation between the proportion of Pueblo and poverty level among females between the ages 18 and 24 in the United States with a correlation coefficient (R) of 0.055 and weighted average of 26.9%, a difference of 41.9%.
Female Poverty Among 18-24 Year Olds Correlation Summary
| Measurement | Immigrants from Cabo Verde | Pueblo |
| Minimum | 4.2% | 1.1% |
| Maximum | 49.6% | 100.0% |
| Range | 45.4% | 98.9% |
| Mean | 19.0% | 39.7% |
| Median | 18.7% | 29.4% |
| Interquartile 25% (IQ1) | 12.7% | 16.7% |
| Interquartile 75% (IQ3) | 23.0% | 51.5% |
| Interquartile Range (IQR) | 10.3% | 34.8% |
| Standard Deviation (Sample) | 9.7% | 29.9% |
| Standard Deviation (Population) | 9.6% | 29.6% |
Similar Demographics by Female Poverty Among 18-24 Year Olds
Demographics Similar to Immigrants from Cabo Verde by Female Poverty Among 18-24 Year Olds
In terms of female poverty among 18-24 year olds, the demographic groups most similar to Immigrants from Cabo Verde are Croatian (19.0%, a difference of 0.020%), Afghan (19.0%, a difference of 0.030%), Romanian (19.0%, a difference of 0.12%), Immigrants from Jamaica (18.9%, a difference of 0.17%), and Filipino (19.0%, a difference of 0.17%).
| Demographics | Rating | Rank | Female Poverty Among 18-24 Year Olds |
| Immigrants | Uruguay | 99.4 /100 | #82 | Exceptional 18.8% |
| Immigrants | Indonesia | 99.4 /100 | #83 | Exceptional 18.9% |
| Burmese | 99.2 /100 | #84 | Exceptional 18.9% |
| Immigrants | Armenia | 99.2 /100 | #85 | Exceptional 18.9% |
| Immigrants | Iraq | 99.2 /100 | #86 | Exceptional 18.9% |
| Immigrants | Jamaica | 99.2 /100 | #87 | Exceptional 18.9% |
| Croatians | 99.1 /100 | #88 | Exceptional 19.0% |
| Immigrants | Cabo Verde | 99.0 /100 | #89 | Exceptional 19.0% |
| Afghans | 99.0 /100 | #90 | Exceptional 19.0% |
| Romanians | 98.9 /100 | #91 | Exceptional 19.0% |
| Filipinos | 98.9 /100 | #92 | Exceptional 19.0% |
| Haitians | 98.9 /100 | #93 | Exceptional 19.0% |
| Ukrainians | 98.8 /100 | #94 | Exceptional 19.0% |
| Guamanians/Chamorros | 98.8 /100 | #95 | Exceptional 19.0% |
| Sierra Leoneans | 98.7 /100 | #96 | Exceptional 19.0% |
Demographics Similar to Pueblo by Female Poverty Among 18-24 Year Olds
In terms of female poverty among 18-24 year olds, the demographic groups most similar to Pueblo are Yup'ik (27.0%, a difference of 0.45%), Apache (26.3%, a difference of 2.2%), Immigrants from Yemen (27.5%, a difference of 2.4%), Houma (26.2%, a difference of 2.8%), and Chippewa (25.9%, a difference of 3.8%).
| Demographics | Rating | Rank | Female Poverty Among 18-24 Year Olds |
| Ute | 0.0 /100 | #327 | Tragic 25.4% |
| Natives/Alaskans | 0.0 /100 | #328 | Tragic 25.4% |
| Cajuns | 0.0 /100 | #329 | Tragic 25.7% |
| Immigrants | Somalia | 0.0 /100 | #330 | Tragic 25.7% |
| Chippewa | 0.0 /100 | #331 | Tragic 25.9% |
| Houma | 0.0 /100 | #332 | Tragic 26.2% |
| Apache | 0.0 /100 | #333 | Tragic 26.3% |
| Pueblo | 0.0 /100 | #334 | Tragic 26.9% |
| Yup'ik | 0.0 /100 | #335 | Tragic 27.0% |
| Immigrants | Yemen | 0.0 /100 | #336 | Tragic 27.5% |
| Cheyenne | 0.0 /100 | #337 | Tragic 28.1% |
| Hopi | 0.0 /100 | #338 | Tragic 28.2% |
| Pima | 0.0 /100 | #339 | Tragic 28.4% |
| Sioux | 0.0 /100 | #340 | Tragic 28.6% |
| Colville | 0.0 /100 | #341 | Tragic 29.0% |