Immigrants from Burma/Myanmar vs Swedish Disability Age 35 to 64
COMPARE
Immigrants from Burma/Myanmar
Swedish
Disability Age 35 to 64
Disability Age 35 to 64 Comparison
Immigrants from Burma/Myanmar
Swedes
12.3%
DISABILITY AGE 35 TO 64
1.2/ 100
METRIC RATING
250th/ 347
METRIC RANK
11.4%
DISABILITY AGE 35 TO 64
31.3/ 100
METRIC RATING
191st/ 347
METRIC RANK
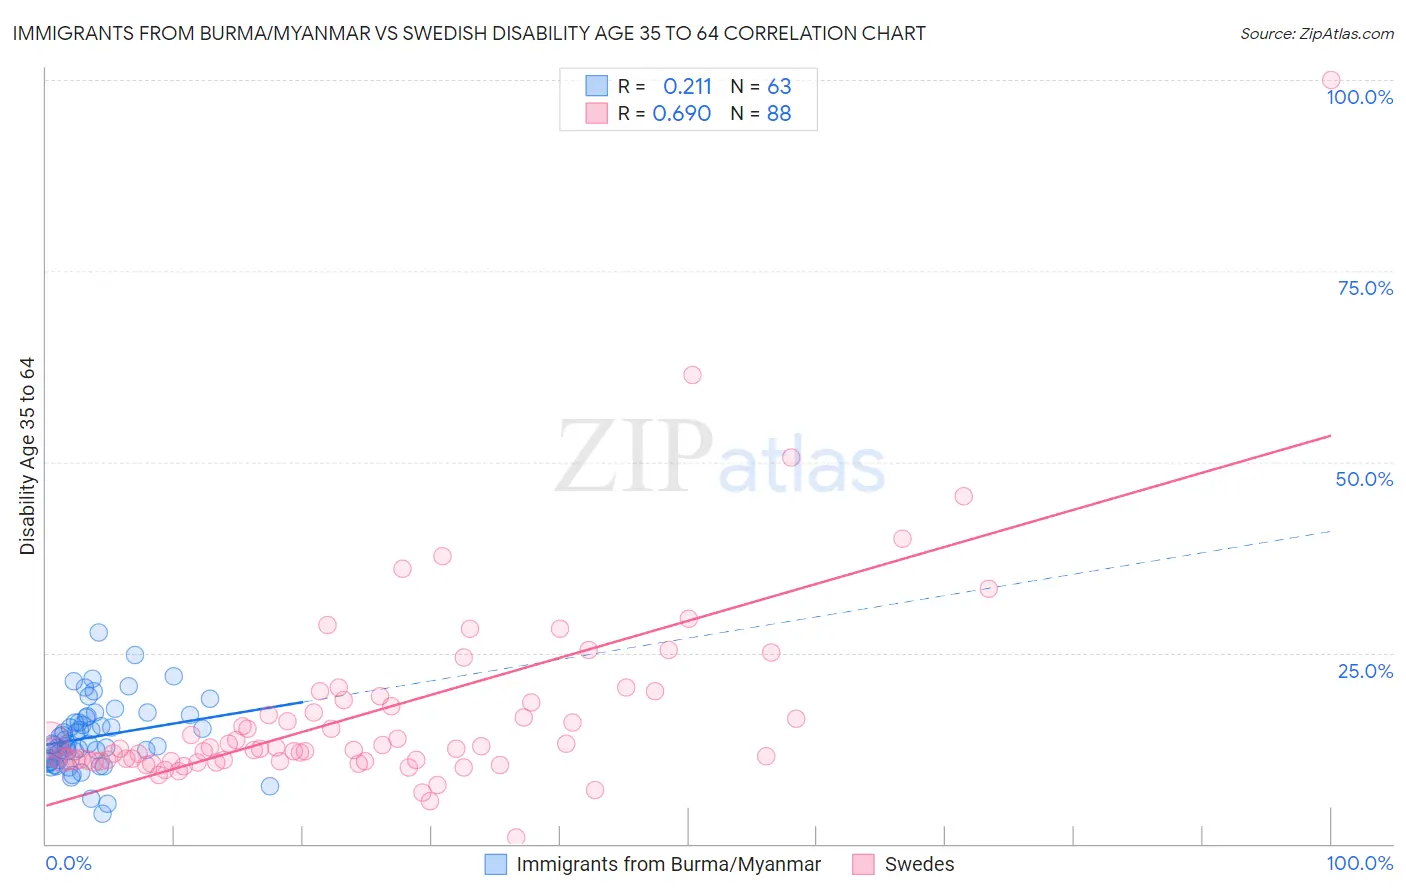
Immigrants from Burma/Myanmar vs Swedish Disability Age 35 to 64 Correlation Chart
The statistical analysis conducted on geographies consisting of 172,272,577 people shows a weak positive correlation between the proportion of Immigrants from Burma/Myanmar and percentage of population with a disability between the ages 34 and 64 in the United States with a correlation coefficient (R) of 0.211 and weighted average of 12.3%. Similarly, the statistical analysis conducted on geographies consisting of 538,454,121 people shows a significant positive correlation between the proportion of Swedes and percentage of population with a disability between the ages 34 and 64 in the United States with a correlation coefficient (R) of 0.690 and weighted average of 11.4%, a difference of 7.2%.
Disability Age 35 to 64 Correlation Summary
| Measurement | Immigrants from Burma/Myanmar | Swedish |
| Minimum | 3.9% | 0.77% |
| Maximum | 27.6% | 100.0% |
| Range | 23.7% | 99.2% |
| Mean | 14.0% | 17.3% |
| Median | 13.1% | 12.5% |
| Interquartile 25% (IQ1) | 11.0% | 10.9% |
| Interquartile 75% (IQ3) | 16.5% | 18.6% |
| Interquartile Range (IQR) | 5.5% | 7.7% |
| Standard Deviation (Sample) | 4.5% | 13.3% |
| Standard Deviation (Population) | 4.5% | 13.3% |
Similar Demographics by Disability Age 35 to 64
Demographics Similar to Immigrants from Burma/Myanmar by Disability Age 35 to 64
In terms of disability age 35 to 64, the demographic groups most similar to Immigrants from Burma/Myanmar are German (12.3%, a difference of 0.080%), Hispanic or Latino (12.3%, a difference of 0.13%), Spaniard (12.3%, a difference of 0.16%), Immigrants from Senegal (12.2%, a difference of 0.26%), and Guamanian/Chamorro (12.2%, a difference of 0.29%).
| Demographics | Rating | Rank | Disability Age 35 to 64 |
| Slovaks | 2.7 /100 | #243 | Tragic 12.1% |
| Finns | 2.3 /100 | #244 | Tragic 12.1% |
| Immigrants | Mexico | 2.2 /100 | #245 | Tragic 12.1% |
| Guamanians/Chamorros | 1.4 /100 | #246 | Tragic 12.2% |
| Immigrants | Senegal | 1.3 /100 | #247 | Tragic 12.2% |
| Spaniards | 1.3 /100 | #248 | Tragic 12.3% |
| Hispanics or Latinos | 1.3 /100 | #249 | Tragic 12.3% |
| Immigrants | Burma/Myanmar | 1.2 /100 | #250 | Tragic 12.3% |
| Germans | 1.1 /100 | #251 | Tragic 12.3% |
| Irish | 1.0 /100 | #252 | Tragic 12.3% |
| Dutch | 1.0 /100 | #253 | Tragic 12.3% |
| Hawaiians | 0.9 /100 | #254 | Tragic 12.3% |
| Japanese | 0.8 /100 | #255 | Tragic 12.3% |
| Scottish | 0.8 /100 | #256 | Tragic 12.4% |
| Mexicans | 0.7 /100 | #257 | Tragic 12.4% |
Demographics Similar to Swedes by Disability Age 35 to 64
In terms of disability age 35 to 64, the demographic groups most similar to Swedes are Immigrants from Nigeria (11.4%, a difference of 0.11%), Norwegian (11.5%, a difference of 0.15%), Immigrants from Africa (11.5%, a difference of 0.22%), Hungarian (11.4%, a difference of 0.30%), and Northern European (11.4%, a difference of 0.32%).
| Demographics | Rating | Rank | Disability Age 35 to 64 |
| Kenyans | 39.2 /100 | #184 | Fair 11.4% |
| Danes | 36.8 /100 | #185 | Fair 11.4% |
| Slovenes | 36.6 /100 | #186 | Fair 11.4% |
| Immigrants | Bosnia and Herzegovina | 35.2 /100 | #187 | Fair 11.4% |
| Northern Europeans | 34.9 /100 | #188 | Fair 11.4% |
| Hungarians | 34.6 /100 | #189 | Fair 11.4% |
| Immigrants | Nigeria | 32.5 /100 | #190 | Fair 11.4% |
| Swedes | 31.3 /100 | #191 | Fair 11.4% |
| Norwegians | 29.7 /100 | #192 | Fair 11.5% |
| Immigrants | Africa | 29.0 /100 | #193 | Fair 11.5% |
| Immigrants | Latin America | 27.5 /100 | #194 | Fair 11.5% |
| Carpatho Rusyns | 25.3 /100 | #195 | Fair 11.5% |
| Iraqis | 24.2 /100 | #196 | Fair 11.5% |
| Immigrants | Iraq | 21.0 /100 | #197 | Fair 11.6% |
| Immigrants | Panama | 20.4 /100 | #198 | Fair 11.6% |