Immigrants from Burma/Myanmar vs Subsaharan African Single Mother Poverty
COMPARE
Immigrants from Burma/Myanmar
Subsaharan African
Single Mother Poverty
Single Mother Poverty Comparison
Immigrants from Burma/Myanmar
Sub-Saharan Africans
30.6%
SINGLE MOTHER POVERTY
1.7/ 100
METRIC RATING
242nd/ 347
METRIC RANK
31.4%
SINGLE MOTHER POVERTY
0.2/ 100
METRIC RATING
266th/ 347
METRIC RANK
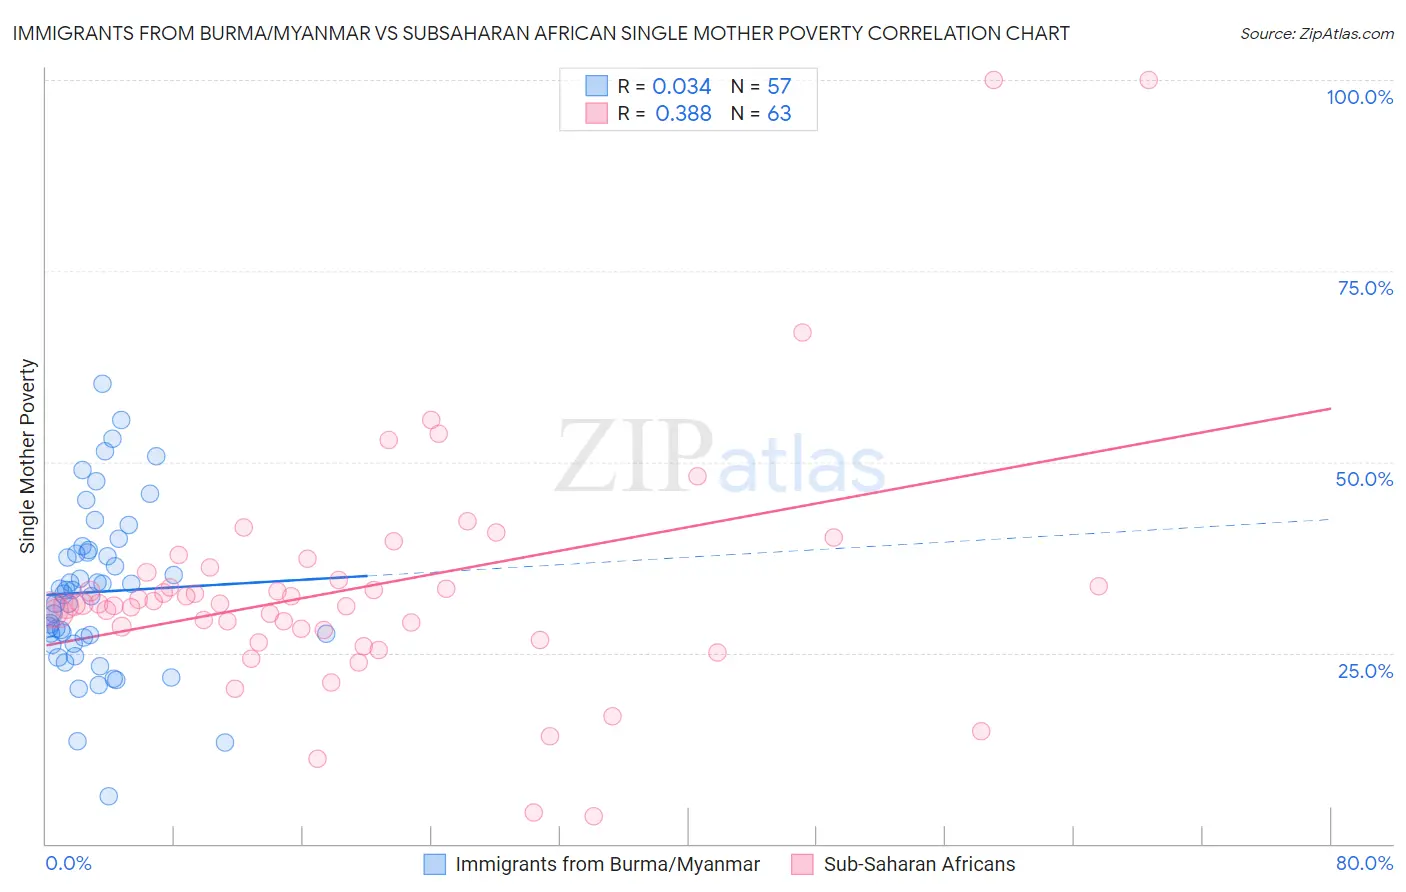
Immigrants from Burma/Myanmar vs Subsaharan African Single Mother Poverty Correlation Chart
The statistical analysis conducted on geographies consisting of 170,565,038 people shows no correlation between the proportion of Immigrants from Burma/Myanmar and poverty level among single mothers in the United States with a correlation coefficient (R) of 0.034 and weighted average of 30.6%. Similarly, the statistical analysis conducted on geographies consisting of 493,508,844 people shows a mild positive correlation between the proportion of Sub-Saharan Africans and poverty level among single mothers in the United States with a correlation coefficient (R) of 0.388 and weighted average of 31.4%, a difference of 2.6%.
Single Mother Poverty Correlation Summary
| Measurement | Immigrants from Burma/Myanmar | Subsaharan African |
| Minimum | 6.2% | 3.7% |
| Maximum | 60.3% | 100.0% |
| Range | 54.0% | 96.3% |
| Mean | 33.0% | 33.5% |
| Median | 32.7% | 31.4% |
| Interquartile 25% (IQ1) | 26.6% | 28.1% |
| Interquartile 75% (IQ3) | 38.3% | 35.5% |
| Interquartile Range (IQR) | 11.7% | 7.4% |
| Standard Deviation (Sample) | 10.6% | 16.1% |
| Standard Deviation (Population) | 10.5% | 16.0% |
Similar Demographics by Single Mother Poverty
Demographics Similar to Immigrants from Burma/Myanmar by Single Mother Poverty
In terms of single mother poverty, the demographic groups most similar to Immigrants from Burma/Myanmar are Immigrants from Laos (30.6%, a difference of 0.020%), Salvadoran (30.6%, a difference of 0.070%), Bermudan (30.6%, a difference of 0.080%), Immigrants from Portugal (30.5%, a difference of 0.20%), and French (30.7%, a difference of 0.30%).
| Demographics | Rating | Rank | Single Mother Poverty |
| Immigrants | Grenada | 3.4 /100 | #235 | Tragic 30.3% |
| Welsh | 3.2 /100 | #236 | Tragic 30.4% |
| Immigrants | St. Vincent and the Grenadines | 3.1 /100 | #237 | Tragic 30.4% |
| Slovaks | 2.8 /100 | #238 | Tragic 30.4% |
| Immigrants | Portugal | 2.1 /100 | #239 | Tragic 30.5% |
| Salvadorans | 1.8 /100 | #240 | Tragic 30.6% |
| Immigrants | Laos | 1.8 /100 | #241 | Tragic 30.6% |
| Immigrants | Burma/Myanmar | 1.7 /100 | #242 | Tragic 30.6% |
| Bermudans | 1.6 /100 | #243 | Tragic 30.6% |
| French | 1.3 /100 | #244 | Tragic 30.7% |
| Barbadians | 1.3 /100 | #245 | Tragic 30.7% |
| Ecuadorians | 0.9 /100 | #246 | Tragic 30.8% |
| West Indians | 0.9 /100 | #247 | Tragic 30.8% |
| French Canadians | 0.9 /100 | #248 | Tragic 30.8% |
| Cape Verdeans | 0.8 /100 | #249 | Tragic 30.8% |
Demographics Similar to Sub-Saharan Africans by Single Mother Poverty
In terms of single mother poverty, the demographic groups most similar to Sub-Saharan Africans are German Russian (31.3%, a difference of 0.070%), Immigrants from Ecuador (31.3%, a difference of 0.090%), Bahamian (31.3%, a difference of 0.11%), Immigrants from Belize (31.4%, a difference of 0.15%), and Immigrants from Senegal (31.5%, a difference of 0.33%).
| Demographics | Rating | Rank | Single Mother Poverty |
| Immigrants | Bangladesh | 0.4 /100 | #259 | Tragic 31.1% |
| Whites/Caucasians | 0.3 /100 | #260 | Tragic 31.2% |
| Immigrants | El Salvador | 0.3 /100 | #261 | Tragic 31.2% |
| Hmong | 0.3 /100 | #262 | Tragic 31.2% |
| Bahamians | 0.2 /100 | #263 | Tragic 31.3% |
| Immigrants | Ecuador | 0.2 /100 | #264 | Tragic 31.3% |
| German Russians | 0.2 /100 | #265 | Tragic 31.3% |
| Sub-Saharan Africans | 0.2 /100 | #266 | Tragic 31.4% |
| Immigrants | Belize | 0.2 /100 | #267 | Tragic 31.4% |
| Immigrants | Senegal | 0.1 /100 | #268 | Tragic 31.5% |
| Scotch-Irish | 0.1 /100 | #269 | Tragic 31.5% |
| British West Indians | 0.1 /100 | #270 | Tragic 31.5% |
| Immigrants | Cabo Verde | 0.1 /100 | #271 | Tragic 31.6% |
| Immigrants | Micronesia | 0.1 /100 | #272 | Tragic 31.6% |
| Fijians | 0.1 /100 | #273 | Tragic 31.6% |