Immigrants from Burma/Myanmar vs Immigrants from West Indies In Labor Force | Age 20-24
COMPARE
Immigrants from Burma/Myanmar
Immigrants from West Indies
In Labor Force | Age 20-24
In Labor Force | Age 20-24 Comparison
Immigrants from Burma/Myanmar
Immigrants from West Indies
76.3%
IN LABOR FORCE | AGE 20-24
99.1/ 100
METRIC RATING
90th/ 347
METRIC RANK
72.4%
IN LABOR FORCE | AGE 20-24
0.0/ 100
METRIC RATING
304th/ 347
METRIC RANK
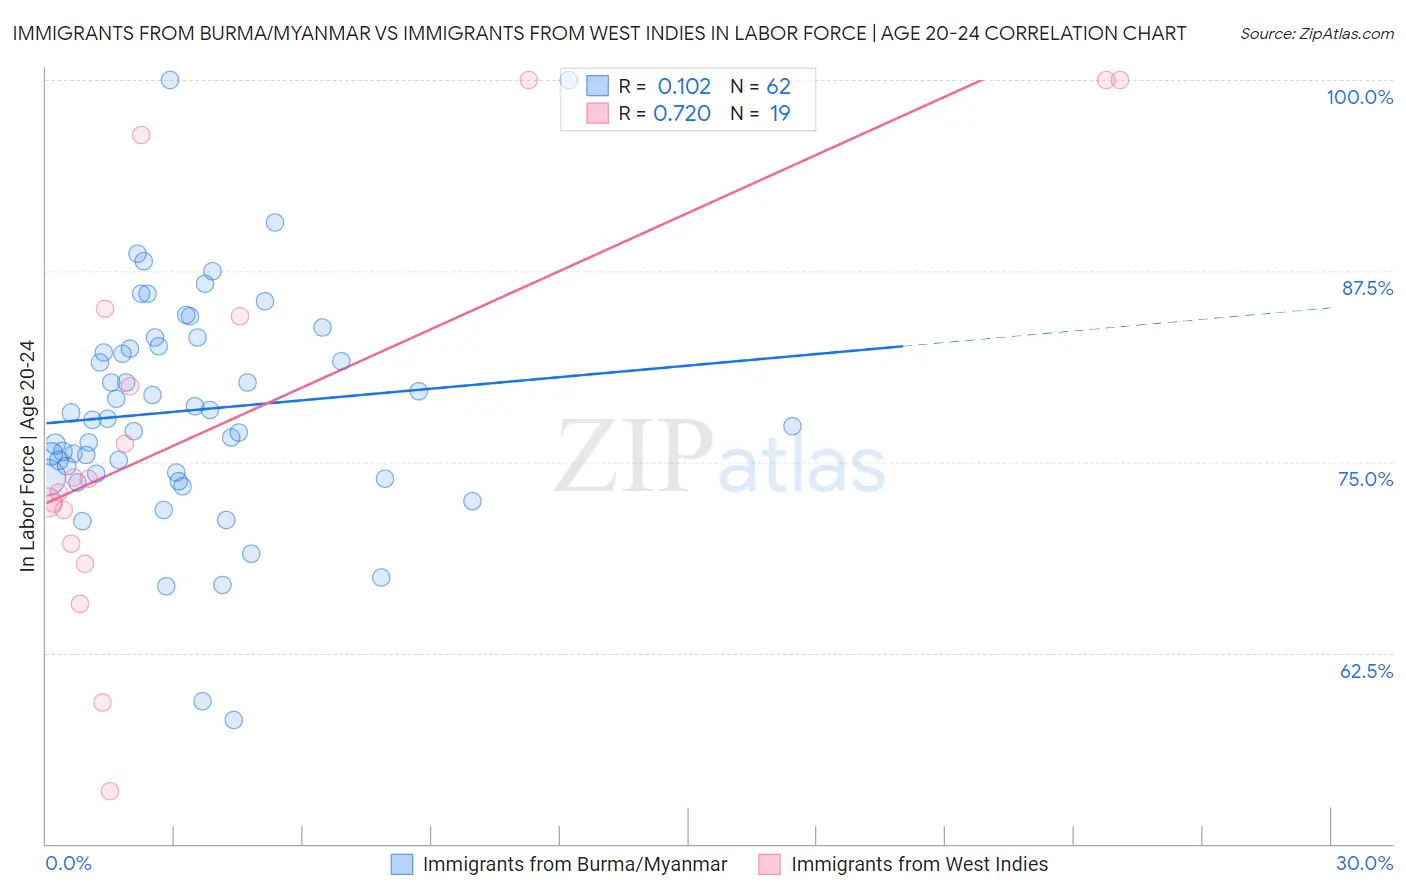
Immigrants from Burma/Myanmar vs Immigrants from West Indies In Labor Force | Age 20-24 Correlation Chart
The statistical analysis conducted on geographies consisting of 172,353,766 people shows a poor positive correlation between the proportion of Immigrants from Burma/Myanmar and labor force participation rate among population between the ages 20 and 24 in the United States with a correlation coefficient (R) of 0.102 and weighted average of 76.3%. Similarly, the statistical analysis conducted on geographies consisting of 72,452,625 people shows a strong positive correlation between the proportion of Immigrants from West Indies and labor force participation rate among population between the ages 20 and 24 in the United States with a correlation coefficient (R) of 0.720 and weighted average of 72.4%, a difference of 5.4%.
In Labor Force | Age 20-24 Correlation Summary
| Measurement | Immigrants from Burma/Myanmar | Immigrants from West Indies |
| Minimum | 58.1% | 53.4% |
| Maximum | 100.0% | 100.0% |
| Range | 41.9% | 46.6% |
| Mean | 78.4% | 77.7% |
| Median | 77.8% | 73.9% |
| Interquartile 25% (IQ1) | 74.3% | 69.6% |
| Interquartile 75% (IQ3) | 82.6% | 85.0% |
| Interquartile Range (IQR) | 8.3% | 15.4% |
| Standard Deviation (Sample) | 7.6% | 13.6% |
| Standard Deviation (Population) | 7.5% | 13.2% |
Similar Demographics by In Labor Force | Age 20-24
Demographics Similar to Immigrants from Burma/Myanmar by In Labor Force | Age 20-24
In terms of in labor force | age 20-24, the demographic groups most similar to Immigrants from Burma/Myanmar are Sierra Leonean (76.3%, a difference of 0.020%), Spanish (76.4%, a difference of 0.050%), Bulgarian (76.4%, a difference of 0.050%), Maltese (76.3%, a difference of 0.050%), and Hungarian (76.3%, a difference of 0.070%).
| Demographics | Rating | Rank | In Labor Force | Age 20-24 |
| Carpatho Rusyns | 99.4 /100 | #83 | Exceptional 76.5% |
| Austrians | 99.4 /100 | #84 | Exceptional 76.5% |
| Portuguese | 99.3 /100 | #85 | Exceptional 76.4% |
| Immigrants | Iraq | 99.3 /100 | #86 | Exceptional 76.4% |
| Immigrants | Thailand | 99.3 /100 | #87 | Exceptional 76.4% |
| Spanish | 99.2 /100 | #88 | Exceptional 76.4% |
| Bulgarians | 99.2 /100 | #89 | Exceptional 76.4% |
| Immigrants | Burma/Myanmar | 99.1 /100 | #90 | Exceptional 76.3% |
| Sierra Leoneans | 99.0 /100 | #91 | Exceptional 76.3% |
| Maltese | 98.9 /100 | #92 | Exceptional 76.3% |
| Hungarians | 98.9 /100 | #93 | Exceptional 76.3% |
| Potawatomi | 98.5 /100 | #94 | Exceptional 76.2% |
| Immigrants | Germany | 98.5 /100 | #95 | Exceptional 76.2% |
| Immigrants | Nonimmigrants | 98.5 /100 | #96 | Exceptional 76.2% |
| Immigrants | Lithuania | 98.0 /100 | #97 | Exceptional 76.1% |
Demographics Similar to Immigrants from West Indies by In Labor Force | Age 20-24
In terms of in labor force | age 20-24, the demographic groups most similar to Immigrants from West Indies are Ecuadorian (72.4%, a difference of 0.010%), Native/Alaskan (72.4%, a difference of 0.020%), Immigrants from Singapore (72.4%, a difference of 0.030%), Immigrants from Jamaica (72.4%, a difference of 0.050%), and Cuban (72.5%, a difference of 0.11%).
| Demographics | Rating | Rank | In Labor Force | Age 20-24 |
| Central American Indians | 0.0 /100 | #297 | Tragic 72.7% |
| Israelis | 0.0 /100 | #298 | Tragic 72.6% |
| Iranians | 0.0 /100 | #299 | Tragic 72.6% |
| Armenians | 0.0 /100 | #300 | Tragic 72.5% |
| Cubans | 0.0 /100 | #301 | Tragic 72.5% |
| Natives/Alaskans | 0.0 /100 | #302 | Tragic 72.4% |
| Ecuadorians | 0.0 /100 | #303 | Tragic 72.4% |
| Immigrants | West Indies | 0.0 /100 | #304 | Tragic 72.4% |
| Immigrants | Singapore | 0.0 /100 | #305 | Tragic 72.4% |
| Immigrants | Jamaica | 0.0 /100 | #306 | Tragic 72.4% |
| Immigrants | Ecuador | 0.0 /100 | #307 | Tragic 72.3% |
| Soviet Union | 0.0 /100 | #308 | Tragic 72.3% |
| Tsimshian | 0.0 /100 | #309 | Tragic 72.3% |
| Immigrants | Cuba | 0.0 /100 | #310 | Tragic 72.0% |
| Apache | 0.0 /100 | #311 | Tragic 72.0% |