Immigrants from Burma/Myanmar vs Immigrants from Grenada College, Under 1 year
COMPARE
Immigrants from Burma/Myanmar
Immigrants from Grenada
College, Under 1 year
College, Under 1 year Comparison
Immigrants from Burma/Myanmar
Immigrants from Grenada
62.5%
COLLEGE, UNDER 1 YEAR
1.6/ 100
METRIC RATING
237th/ 347
METRIC RANK
59.1%
COLLEGE, UNDER 1 YEAR
0.0/ 100
METRIC RATING
295th/ 347
METRIC RANK
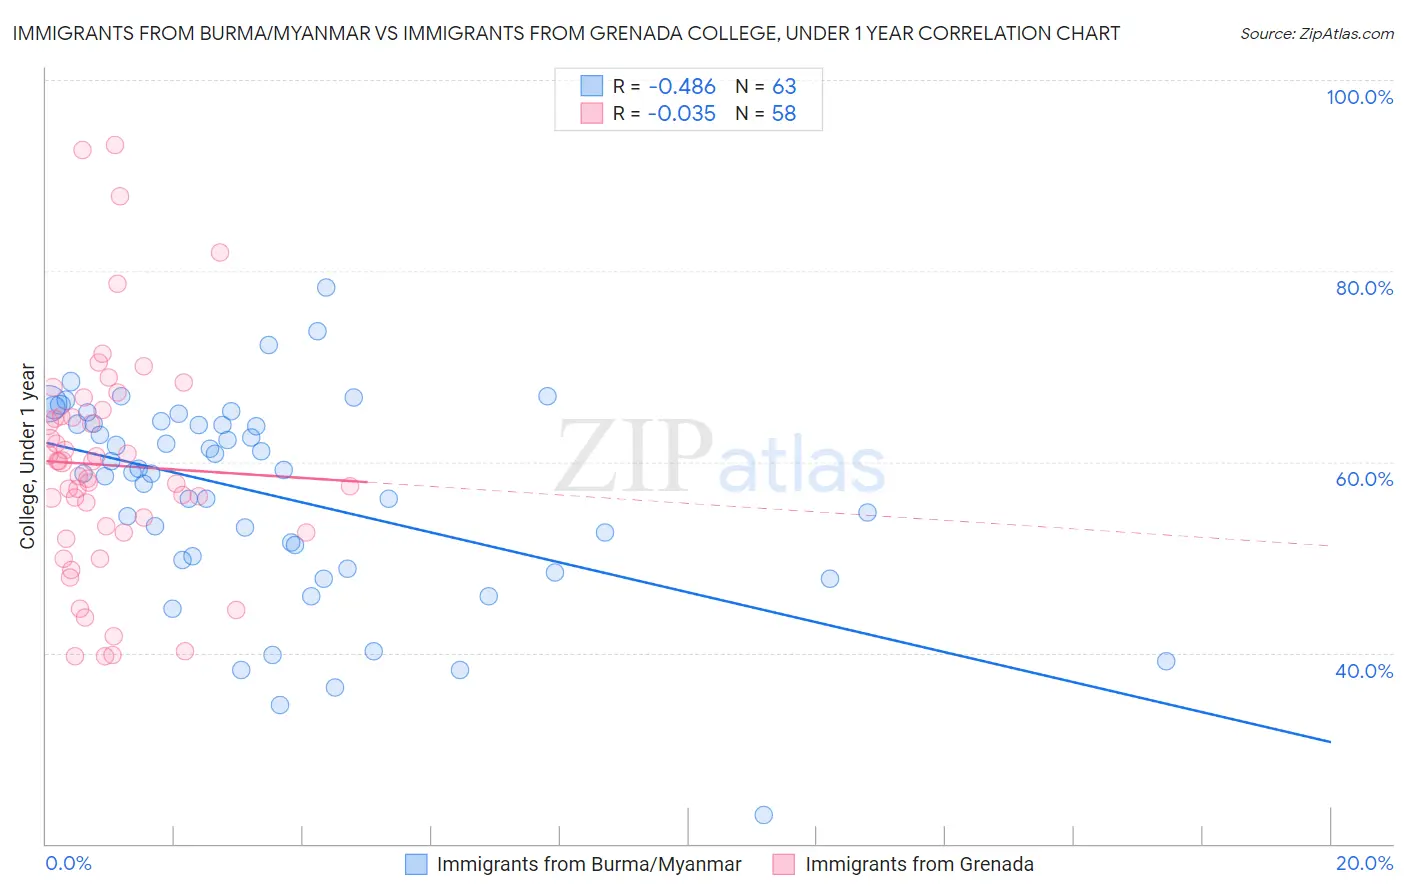
Immigrants from Burma/Myanmar vs Immigrants from Grenada College, Under 1 year Correlation Chart
The statistical analysis conducted on geographies consisting of 172,357,324 people shows a moderate negative correlation between the proportion of Immigrants from Burma/Myanmar and percentage of population with at least college, under 1 year education in the United States with a correlation coefficient (R) of -0.486 and weighted average of 62.5%. Similarly, the statistical analysis conducted on geographies consisting of 67,201,096 people shows no correlation between the proportion of Immigrants from Grenada and percentage of population with at least college, under 1 year education in the United States with a correlation coefficient (R) of -0.035 and weighted average of 59.1%, a difference of 5.8%.
College, Under 1 year Correlation Summary
| Measurement | Immigrants from Burma/Myanmar | Immigrants from Grenada |
| Minimum | 23.1% | 39.6% |
| Maximum | 78.3% | 93.2% |
| Range | 55.2% | 53.6% |
| Mean | 56.5% | 59.7% |
| Median | 58.9% | 59.3% |
| Interquartile 25% (IQ1) | 49.7% | 52.6% |
| Interquartile 75% (IQ3) | 64.1% | 64.8% |
| Interquartile Range (IQR) | 14.4% | 12.2% |
| Standard Deviation (Sample) | 10.7% | 11.9% |
| Standard Deviation (Population) | 10.6% | 11.8% |
Similar Demographics by College, Under 1 year
Demographics Similar to Immigrants from Burma/Myanmar by College, Under 1 year
In terms of college, under 1 year, the demographic groups most similar to Immigrants from Burma/Myanmar are Immigrants (62.5%, a difference of 0.030%), French American Indian (62.4%, a difference of 0.090%), Spanish American (62.6%, a difference of 0.16%), Chippewa (62.6%, a difference of 0.21%), and Iroquois (62.6%, a difference of 0.24%).
| Demographics | Rating | Rank | College, Under 1 year |
| Immigrants | Nonimmigrants | 3.0 /100 | #230 | Tragic 62.9% |
| Immigrants | Western Africa | 2.4 /100 | #231 | Tragic 62.8% |
| Osage | 2.2 /100 | #232 | Tragic 62.7% |
| Iroquois | 2.0 /100 | #233 | Tragic 62.6% |
| Chippewa | 2.0 /100 | #234 | Tragic 62.6% |
| Spanish Americans | 1.9 /100 | #235 | Tragic 62.6% |
| Immigrants | Immigrants | 1.7 /100 | #236 | Tragic 62.5% |
| Immigrants | Burma/Myanmar | 1.6 /100 | #237 | Tragic 62.5% |
| French American Indians | 1.5 /100 | #238 | Tragic 62.4% |
| Nepalese | 1.1 /100 | #239 | Tragic 62.2% |
| Aleuts | 1.1 /100 | #240 | Tragic 62.2% |
| Ottawa | 1.1 /100 | #241 | Tragic 62.2% |
| Malaysians | 1.1 /100 | #242 | Tragic 62.2% |
| Hawaiians | 1.1 /100 | #243 | Tragic 62.1% |
| Colville | 1.0 /100 | #244 | Tragic 62.1% |
Demographics Similar to Immigrants from Grenada by College, Under 1 year
In terms of college, under 1 year, the demographic groups most similar to Immigrants from Grenada are Central American Indian (59.0%, a difference of 0.040%), Guyanese (59.0%, a difference of 0.080%), Immigrants from Belize (59.1%, a difference of 0.10%), Seminole (59.1%, a difference of 0.12%), and Nicaraguan (59.2%, a difference of 0.31%).
| Demographics | Rating | Rank | College, Under 1 year |
| Blacks/African Americans | 0.0 /100 | #288 | Tragic 59.4% |
| Choctaw | 0.0 /100 | #289 | Tragic 59.3% |
| Ecuadorians | 0.0 /100 | #290 | Tragic 59.3% |
| Creek | 0.0 /100 | #291 | Tragic 59.3% |
| Nicaraguans | 0.0 /100 | #292 | Tragic 59.2% |
| Seminole | 0.0 /100 | #293 | Tragic 59.1% |
| Immigrants | Belize | 0.0 /100 | #294 | Tragic 59.1% |
| Immigrants | Grenada | 0.0 /100 | #295 | Tragic 59.1% |
| Central American Indians | 0.0 /100 | #296 | Tragic 59.0% |
| Guyanese | 0.0 /100 | #297 | Tragic 59.0% |
| Immigrants | Ecuador | 0.0 /100 | #298 | Tragic 58.7% |
| Cubans | 0.0 /100 | #299 | Tragic 58.6% |
| Immigrants | Guyana | 0.0 /100 | #300 | Tragic 58.5% |
| Mexican American Indians | 0.0 /100 | #301 | Tragic 58.1% |
| Apache | 0.0 /100 | #302 | Tragic 58.0% |