Immigrants from Burma/Myanmar vs Immigrants from Grenada 2nd Grade
COMPARE
Immigrants from Burma/Myanmar
Immigrants from Grenada
2nd Grade
2nd Grade Comparison
Immigrants from Burma/Myanmar
Immigrants from Grenada
96.7%
2ND GRADE
0.0/ 100
METRIC RATING
321st/ 347
METRIC RANK
97.1%
2ND GRADE
0.0/ 100
METRIC RATING
295th/ 347
METRIC RANK
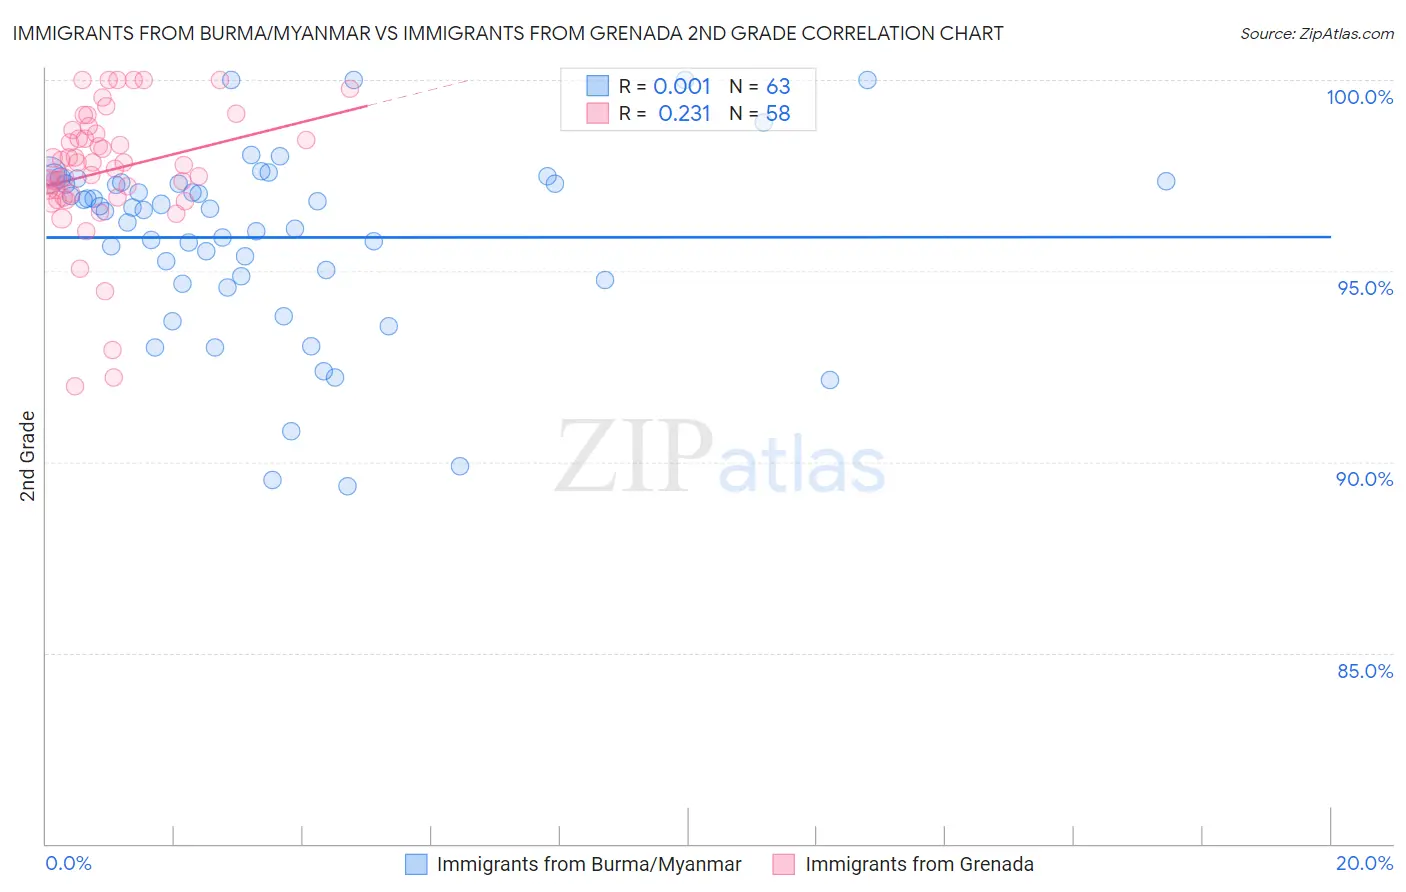
Immigrants from Burma/Myanmar vs Immigrants from Grenada 2nd Grade Correlation Chart
The statistical analysis conducted on geographies consisting of 172,338,093 people shows no correlation between the proportion of Immigrants from Burma/Myanmar and percentage of population with at least 2nd grade education in the United States with a correlation coefficient (R) of 0.001 and weighted average of 96.7%. Similarly, the statistical analysis conducted on geographies consisting of 67,200,336 people shows a weak positive correlation between the proportion of Immigrants from Grenada and percentage of population with at least 2nd grade education in the United States with a correlation coefficient (R) of 0.231 and weighted average of 97.1%, a difference of 0.40%.
2nd Grade Correlation Summary
| Measurement | Immigrants from Burma/Myanmar | Immigrants from Grenada |
| Minimum | 89.4% | 92.0% |
| Maximum | 100.0% | 100.0% |
| Range | 10.6% | 8.0% |
| Mean | 95.9% | 97.6% |
| Median | 96.6% | 97.8% |
| Interquartile 25% (IQ1) | 94.8% | 96.9% |
| Interquartile 75% (IQ3) | 97.3% | 98.6% |
| Interquartile Range (IQR) | 2.5% | 1.7% |
| Standard Deviation (Sample) | 2.4% | 1.7% |
| Standard Deviation (Population) | 2.4% | 1.7% |
Similar Demographics by 2nd Grade
Demographics Similar to Immigrants from Burma/Myanmar by 2nd Grade
In terms of 2nd grade, the demographic groups most similar to Immigrants from Burma/Myanmar are Immigrants from Guyana (96.7%, a difference of 0.0%), Honduran (96.7%, a difference of 0.010%), Immigrants from Laos (96.7%, a difference of 0.010%), Indonesian (96.7%, a difference of 0.010%), and Immigrants from Nicaragua (96.7%, a difference of 0.010%).
| Demographics | Rating | Rank | 2nd Grade |
| Immigrants | Ecuador | 0.0 /100 | #314 | Tragic 96.8% |
| Immigrants | Belize | 0.0 /100 | #315 | Tragic 96.8% |
| Hondurans | 0.0 /100 | #316 | Tragic 96.7% |
| Immigrants | Laos | 0.0 /100 | #317 | Tragic 96.7% |
| Indonesians | 0.0 /100 | #318 | Tragic 96.7% |
| Immigrants | Nicaragua | 0.0 /100 | #319 | Tragic 96.7% |
| Immigrants | Guyana | 0.0 /100 | #320 | Tragic 96.7% |
| Immigrants | Burma/Myanmar | 0.0 /100 | #321 | Tragic 96.7% |
| Immigrants | Bangladesh | 0.0 /100 | #322 | Tragic 96.7% |
| Vietnamese | 0.0 /100 | #323 | Tragic 96.7% |
| Mexican American Indians | 0.0 /100 | #324 | Tragic 96.7% |
| Dominicans | 0.0 /100 | #325 | Tragic 96.6% |
| Immigrants | Honduras | 0.0 /100 | #326 | Tragic 96.6% |
| Immigrants | Vietnam | 0.0 /100 | #327 | Tragic 96.5% |
| Mexicans | 0.0 /100 | #328 | Tragic 96.5% |
Demographics Similar to Immigrants from Grenada by 2nd Grade
In terms of 2nd grade, the demographic groups most similar to Immigrants from Grenada are Malaysian (97.1%, a difference of 0.020%), British West Indian (97.2%, a difference of 0.040%), Immigrants (97.1%, a difference of 0.040%), Immigrants from Eritrea (97.2%, a difference of 0.050%), and Houma (97.2%, a difference of 0.080%).
| Demographics | Rating | Rank | 2nd Grade |
| Immigrants | Thailand | 0.0 /100 | #288 | Tragic 97.2% |
| Houma | 0.0 /100 | #289 | Tragic 97.2% |
| Immigrants | St. Vincent and the Grenadines | 0.0 /100 | #290 | Tragic 97.2% |
| Immigrants | Afghanistan | 0.0 /100 | #291 | Tragic 97.2% |
| Immigrants | Eritrea | 0.0 /100 | #292 | Tragic 97.2% |
| British West Indians | 0.0 /100 | #293 | Tragic 97.2% |
| Malaysians | 0.0 /100 | #294 | Tragic 97.1% |
| Immigrants | Grenada | 0.0 /100 | #295 | Tragic 97.1% |
| Immigrants | Immigrants | 0.0 /100 | #296 | Tragic 97.1% |
| Immigrants | Cuba | 0.0 /100 | #297 | Tragic 97.0% |
| Immigrants | Dominica | 0.0 /100 | #298 | Tragic 97.0% |
| Haitians | 0.0 /100 | #299 | Tragic 97.0% |
| Immigrants | South Eastern Asia | 0.0 /100 | #300 | Tragic 97.0% |
| Central American Indians | 0.0 /100 | #301 | Tragic 97.0% |
| Somalis | 0.0 /100 | #302 | Tragic 97.0% |