Immigrants from Burma/Myanmar vs Delaware Disability Age 65 to 74
COMPARE
Immigrants from Burma/Myanmar
Delaware
Disability Age 65 to 74
Disability Age 65 to 74 Comparison
Immigrants from Burma/Myanmar
Delaware
24.0%
DISABILITY AGE 65 TO 74
11.6/ 100
METRIC RATING
219th/ 347
METRIC RANK
25.9%
DISABILITY AGE 65 TO 74
0.1/ 100
METRIC RATING
282nd/ 347
METRIC RANK
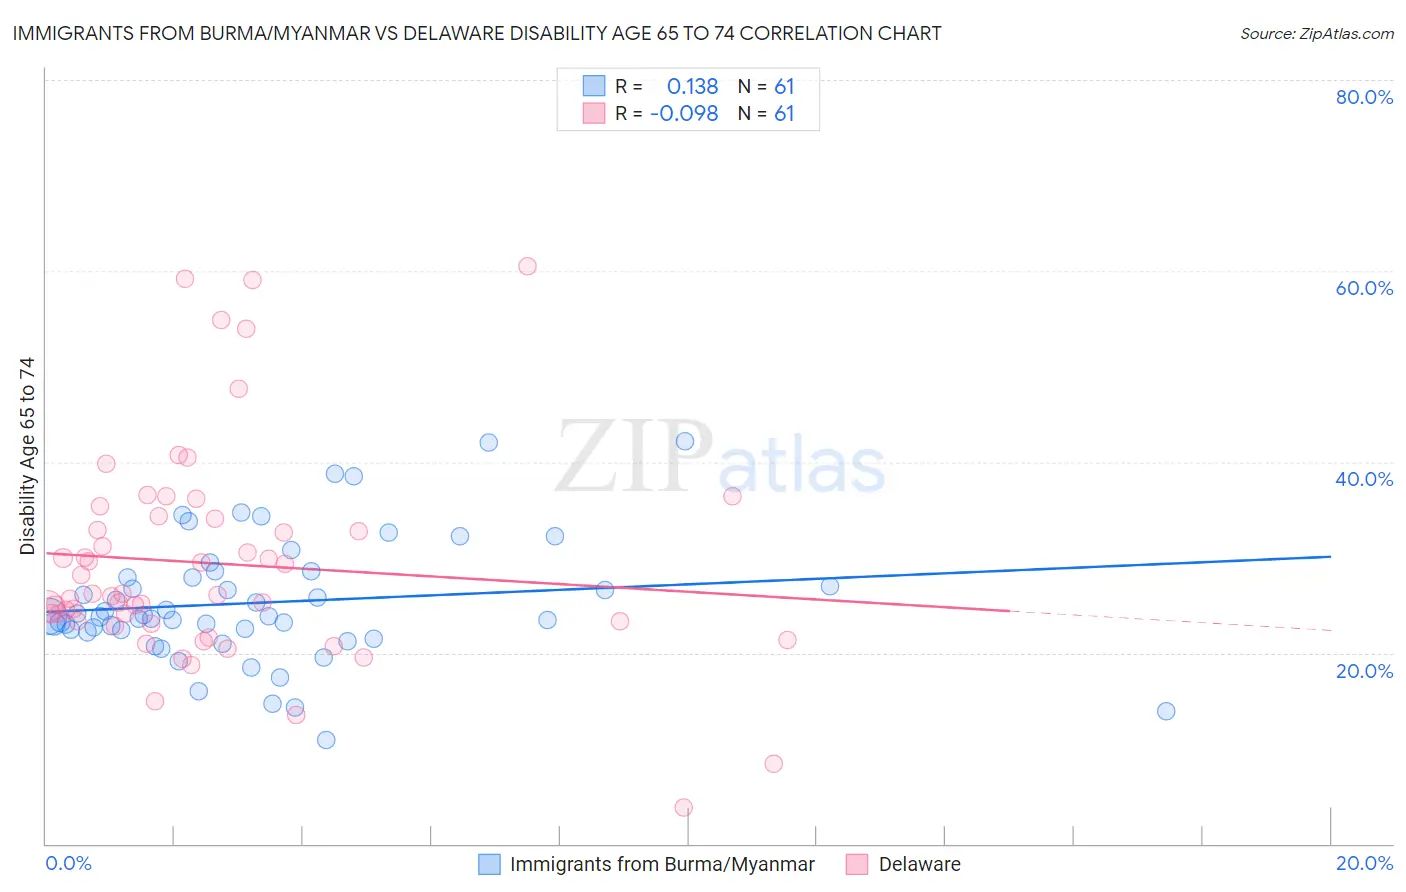
Immigrants from Burma/Myanmar vs Delaware Disability Age 65 to 74 Correlation Chart
The statistical analysis conducted on geographies consisting of 172,172,101 people shows a poor positive correlation between the proportion of Immigrants from Burma/Myanmar and percentage of population with a disability between the ages 65 and 75 in the United States with a correlation coefficient (R) of 0.138 and weighted average of 24.0%. Similarly, the statistical analysis conducted on geographies consisting of 96,201,129 people shows a slight negative correlation between the proportion of Delaware and percentage of population with a disability between the ages 65 and 75 in the United States with a correlation coefficient (R) of -0.098 and weighted average of 25.9%, a difference of 7.8%.
Disability Age 65 to 74 Correlation Summary
| Measurement | Immigrants from Burma/Myanmar | Delaware |
| Minimum | 10.8% | 3.8% |
| Maximum | 42.1% | 60.5% |
| Range | 31.3% | 56.6% |
| Mean | 25.3% | 29.3% |
| Median | 23.9% | 26.1% |
| Interquartile 25% (IQ1) | 22.3% | 23.2% |
| Interquartile 75% (IQ3) | 28.3% | 34.2% |
| Interquartile Range (IQR) | 6.0% | 11.0% |
| Standard Deviation (Sample) | 6.5% | 11.4% |
| Standard Deviation (Population) | 6.4% | 11.3% |
Similar Demographics by Disability Age 65 to 74
Demographics Similar to Immigrants from Burma/Myanmar by Disability Age 65 to 74
In terms of disability age 65 to 74, the demographic groups most similar to Immigrants from Burma/Myanmar are Immigrants from Portugal (24.0%, a difference of 0.020%), Immigrants from Nigeria (24.0%, a difference of 0.020%), Jamaican (24.0%, a difference of 0.090%), Ghanaian (24.1%, a difference of 0.18%), and Pennsylvania German (24.0%, a difference of 0.22%).
| Demographics | Rating | Rank | Disability Age 65 to 74 |
| French | 15.7 /100 | #212 | Poor 23.9% |
| Nicaraguans | 14.3 /100 | #213 | Poor 23.9% |
| Immigrants | Oceania | 13.6 /100 | #214 | Poor 24.0% |
| Pennsylvania Germans | 13.3 /100 | #215 | Poor 24.0% |
| Jamaicans | 12.2 /100 | #216 | Poor 24.0% |
| Immigrants | Portugal | 11.7 /100 | #217 | Poor 24.0% |
| Immigrants | Nigeria | 11.7 /100 | #218 | Poor 24.0% |
| Immigrants | Burma/Myanmar | 11.6 /100 | #219 | Poor 24.0% |
| Ghanaians | 10.4 /100 | #220 | Poor 24.1% |
| Immigrants | Nicaragua | 9.8 /100 | #221 | Tragic 24.1% |
| Native Hawaiians | 9.3 /100 | #222 | Tragic 24.1% |
| Immigrants | Middle Africa | 8.9 /100 | #223 | Tragic 24.1% |
| Immigrants | Panama | 8.6 /100 | #224 | Tragic 24.1% |
| Bermudans | 8.2 /100 | #225 | Tragic 24.2% |
| Iraqis | 8.1 /100 | #226 | Tragic 24.2% |
Demographics Similar to Delaware by Disability Age 65 to 74
In terms of disability age 65 to 74, the demographic groups most similar to Delaware are Immigrants from Honduras (25.9%, a difference of 0.070%), Cree (25.9%, a difference of 0.090%), Spanish American (25.9%, a difference of 0.14%), U.S. Virgin Islander (25.9%, a difference of 0.18%), and Immigrants from Belize (25.8%, a difference of 0.26%).
| Demographics | Rating | Rank | Disability Age 65 to 74 |
| Hondurans | 0.1 /100 | #275 | Tragic 25.8% |
| French American Indians | 0.1 /100 | #276 | Tragic 25.8% |
| Belizeans | 0.1 /100 | #277 | Tragic 25.8% |
| Immigrants | Belize | 0.1 /100 | #278 | Tragic 25.8% |
| U.S. Virgin Islanders | 0.1 /100 | #279 | Tragic 25.9% |
| Cree | 0.1 /100 | #280 | Tragic 25.9% |
| Immigrants | Honduras | 0.1 /100 | #281 | Tragic 25.9% |
| Delaware | 0.1 /100 | #282 | Tragic 25.9% |
| Spanish Americans | 0.0 /100 | #283 | Tragic 25.9% |
| Immigrants | Azores | 0.0 /100 | #284 | Tragic 26.0% |
| Immigrants | Congo | 0.0 /100 | #285 | Tragic 26.0% |
| Immigrants | Micronesia | 0.0 /100 | #286 | Tragic 26.1% |
| Immigrants | Laos | 0.0 /100 | #287 | Tragic 26.1% |
| Mexican American Indians | 0.0 /100 | #288 | Tragic 26.2% |
| Africans | 0.0 /100 | #289 | Tragic 26.2% |