Immigrants from Bulgaria vs Ugandan Unemployment Among Ages 65 to 74 years
COMPARE
Immigrants from Bulgaria
Ugandan
Unemployment Among Ages 65 to 74 years
Unemployment Among Ages 65 to 74 years Comparison
Immigrants from Bulgaria
Ugandans
5.1%
UNEMPLOYMENT AMONG AGES 65 TO 74 YEARS
99.4/ 100
METRIC RATING
59th/ 347
METRIC RANK
5.1%
UNEMPLOYMENT AMONG AGES 65 TO 74 YEARS
99.9/ 100
METRIC RATING
41st/ 347
METRIC RANK
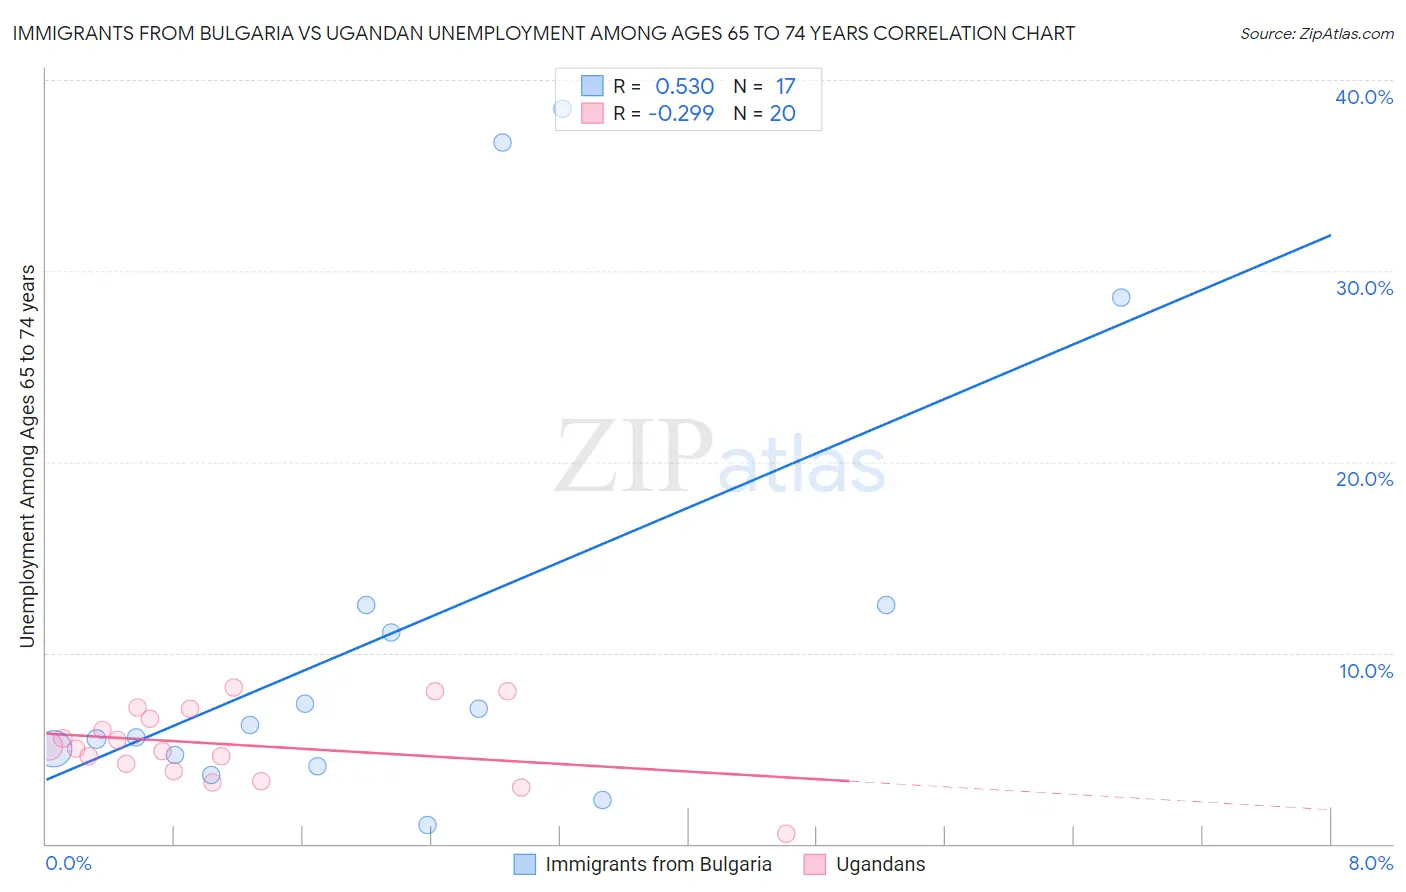
Immigrants from Bulgaria vs Ugandan Unemployment Among Ages 65 to 74 years Correlation Chart
The statistical analysis conducted on geographies consisting of 163,435,792 people shows a substantial positive correlation between the proportion of Immigrants from Bulgaria and unemployment rate among population between the ages 65 and 74 in the United States with a correlation coefficient (R) of 0.530 and weighted average of 5.1%. Similarly, the statistical analysis conducted on geographies consisting of 91,368,960 people shows a weak negative correlation between the proportion of Ugandans and unemployment rate among population between the ages 65 and 74 in the United States with a correlation coefficient (R) of -0.299 and weighted average of 5.1%, a difference of 1.6%.
Unemployment Among Ages 65 to 74 years Correlation Summary
| Measurement | Immigrants from Bulgaria | Ugandan |
| Minimum | 1.0% | 0.50% |
| Maximum | 38.5% | 8.2% |
| Range | 37.5% | 7.7% |
| Mean | 11.3% | 5.2% |
| Median | 6.2% | 5.1% |
| Interquartile 25% (IQ1) | 4.4% | 4.0% |
| Interquartile 75% (IQ3) | 12.5% | 6.8% |
| Interquartile Range (IQR) | 8.1% | 2.8% |
| Standard Deviation (Sample) | 11.7% | 2.0% |
| Standard Deviation (Population) | 11.4% | 1.9% |
Demographics Similar to Immigrants from Bulgaria and Ugandans by Unemployment Among Ages 65 to 74 years
In terms of unemployment among ages 65 to 74 years, the demographic groups most similar to Immigrants from Bulgaria are German (5.1%, a difference of 0.050%), Immigrants from Jordan (5.1%, a difference of 0.050%), Swedish (5.1%, a difference of 0.10%), Croatian (5.1%, a difference of 0.10%), and Carpatho Rusyn (5.1%, a difference of 0.18%). Similarly, the demographic groups most similar to Ugandans are Immigrants from Iraq (5.1%, a difference of 0.010%), Jordanian (5.1%, a difference of 0.15%), Assyrian/Chaldean/Syriac (5.1%, a difference of 0.27%), Immigrants from India (5.1%, a difference of 0.36%), and Sioux (5.1%, a difference of 0.47%).
| Demographics | Rating | Rank | Unemployment Among Ages 65 to 74 years |
| Immigrants | Iraq | 99.9 /100 | #40 | Exceptional 5.1% |
| Ugandans | 99.9 /100 | #41 | Exceptional 5.1% |
| Jordanians | 99.9 /100 | #42 | Exceptional 5.1% |
| Assyrians/Chaldeans/Syriacs | 99.9 /100 | #43 | Exceptional 5.1% |
| Immigrants | India | 99.9 /100 | #44 | Exceptional 5.1% |
| Sioux | 99.8 /100 | #45 | Exceptional 5.1% |
| Immigrants | Kenya | 99.8 /100 | #46 | Exceptional 5.1% |
| Immigrants | Uganda | 99.8 /100 | #47 | Exceptional 5.1% |
| Choctaw | 99.8 /100 | #48 | Exceptional 5.1% |
| Immigrants | Austria | 99.8 /100 | #49 | Exceptional 5.1% |
| Immigrants | Zimbabwe | 99.7 /100 | #50 | Exceptional 5.1% |
| Immigrants | Kazakhstan | 99.7 /100 | #51 | Exceptional 5.1% |
| Europeans | 99.6 /100 | #52 | Exceptional 5.1% |
| Immigrants | Ethiopia | 99.6 /100 | #53 | Exceptional 5.1% |
| Immigrants | Nicaragua | 99.6 /100 | #54 | Exceptional 5.1% |
| Carpatho Rusyns | 99.6 /100 | #55 | Exceptional 5.1% |
| Swedes | 99.5 /100 | #56 | Exceptional 5.1% |
| Croatians | 99.5 /100 | #57 | Exceptional 5.1% |
| Germans | 99.5 /100 | #58 | Exceptional 5.1% |
| Immigrants | Bulgaria | 99.4 /100 | #59 | Exceptional 5.1% |
| Immigrants | Jordan | 99.4 /100 | #60 | Exceptional 5.1% |