Immigrants from France vs Okinawan Disability
COMPARE
Immigrants from France
Okinawan
Disability
Disability Comparison
Immigrants from France
Okinawans
11.0%
DISABILITY
99.4/ 100
METRIC RATING
70th/ 347
METRIC RANK
10.3%
DISABILITY
100.0/ 100
METRIC RATING
15th/ 347
METRIC RANK
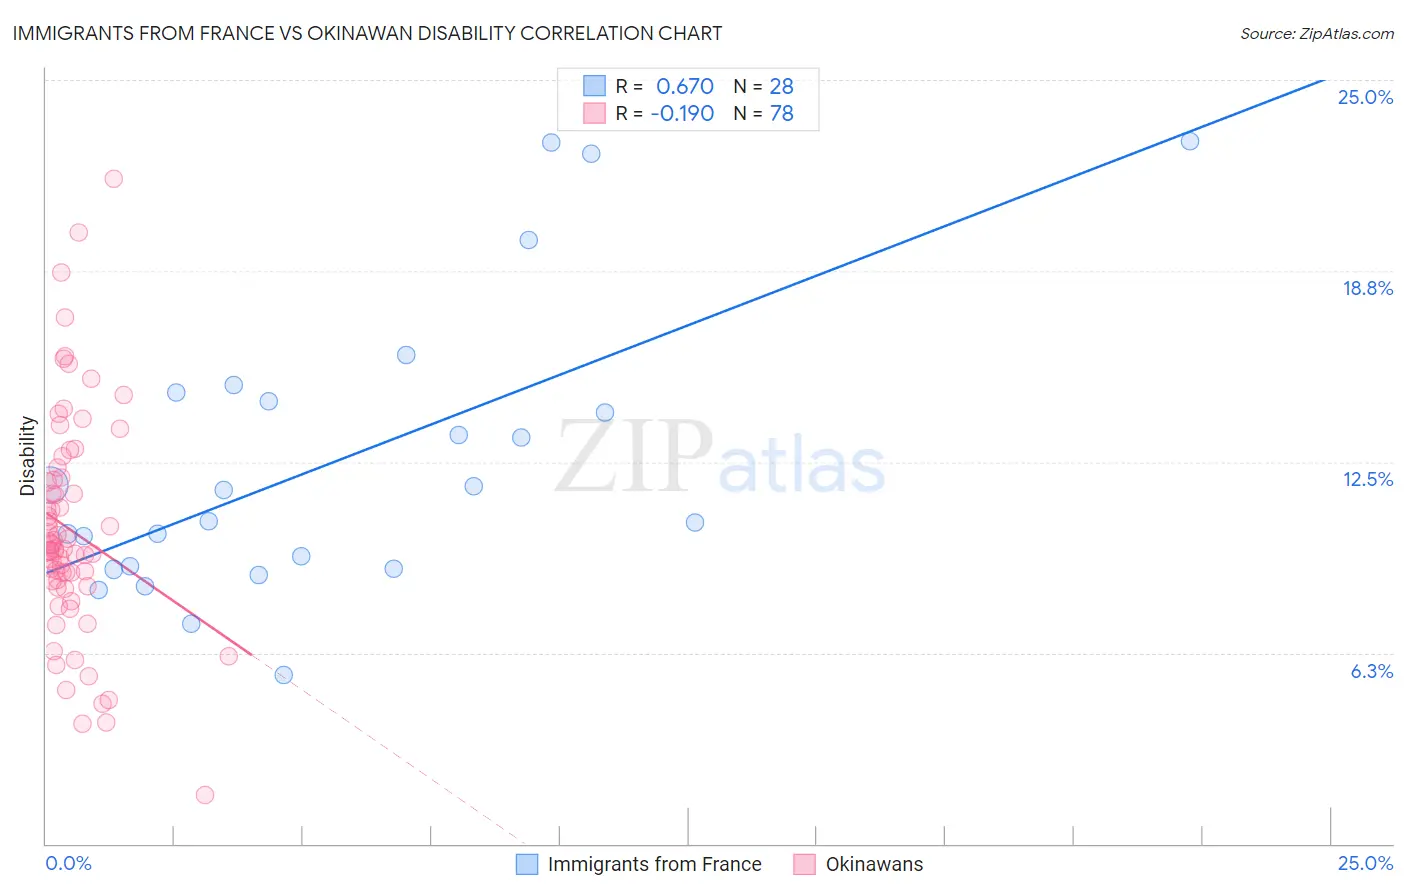
Immigrants from France vs Okinawan Disability Correlation Chart
The statistical analysis conducted on geographies consisting of 287,909,175 people shows a significant positive correlation between the proportion of Immigrants from France and percentage of population with a disability in the United States with a correlation coefficient (R) of 0.670 and weighted average of 11.0%. Similarly, the statistical analysis conducted on geographies consisting of 73,770,333 people shows a poor negative correlation between the proportion of Okinawans and percentage of population with a disability in the United States with a correlation coefficient (R) of -0.190 and weighted average of 10.3%, a difference of 7.6%.
Disability Correlation Summary
| Measurement | Immigrants from France | Okinawan |
| Minimum | 5.5% | 1.6% |
| Maximum | 23.0% | 21.8% |
| Range | 17.5% | 20.2% |
| Mean | 12.5% | 10.3% |
| Median | 11.1% | 9.6% |
| Interquartile 25% (IQ1) | 9.0% | 8.6% |
| Interquartile 75% (IQ3) | 14.6% | 11.9% |
| Interquartile Range (IQR) | 5.6% | 3.3% |
| Standard Deviation (Sample) | 4.7% | 3.6% |
| Standard Deviation (Population) | 4.6% | 3.6% |
Similar Demographics by Disability
Demographics Similar to Immigrants from France by Disability
In terms of disability, the demographic groups most similar to Immigrants from France are Immigrants from Lebanon (11.0%, a difference of 0.020%), Sri Lankan (11.0%, a difference of 0.080%), Immigrants from Chile (11.0%, a difference of 0.10%), Immigrants from Bangladesh (11.0%, a difference of 0.13%), and Immigrants from Serbia (11.0%, a difference of 0.15%).
| Demographics | Rating | Rank | Disability |
| Immigrants | Eritrea | 99.7 /100 | #63 | Exceptional 11.0% |
| Immigrants | Sweden | 99.6 /100 | #64 | Exceptional 11.0% |
| Bulgarians | 99.6 /100 | #65 | Exceptional 11.0% |
| Laotians | 99.6 /100 | #66 | Exceptional 11.0% |
| Colombians | 99.6 /100 | #67 | Exceptional 11.0% |
| Immigrants | Afghanistan | 99.6 /100 | #68 | Exceptional 11.0% |
| Sri Lankans | 99.5 /100 | #69 | Exceptional 11.0% |
| Immigrants | France | 99.4 /100 | #70 | Exceptional 11.0% |
| Immigrants | Lebanon | 99.4 /100 | #71 | Exceptional 11.0% |
| Immigrants | Chile | 99.4 /100 | #72 | Exceptional 11.0% |
| Immigrants | Bangladesh | 99.4 /100 | #73 | Exceptional 11.0% |
| Immigrants | Serbia | 99.4 /100 | #74 | Exceptional 11.0% |
| Immigrants | Vietnam | 99.4 /100 | #75 | Exceptional 11.0% |
| Sierra Leoneans | 99.3 /100 | #76 | Exceptional 11.0% |
| Immigrants | Belgium | 99.3 /100 | #77 | Exceptional 11.0% |
Demographics Similar to Okinawans by Disability
In terms of disability, the demographic groups most similar to Okinawans are Indian (Asian) (10.3%, a difference of 0.070%), Immigrants from Iran (10.3%, a difference of 0.13%), Immigrants from Korea (10.2%, a difference of 0.31%), Immigrants from Eastern Asia (10.2%, a difference of 0.91%), and Immigrants from Israel (10.1%, a difference of 1.1%).
| Demographics | Rating | Rank | Disability |
| Bolivians | 100.0 /100 | #8 | Exceptional 10.0% |
| Immigrants | Hong Kong | 100.0 /100 | #9 | Exceptional 10.0% |
| Immigrants | China | 100.0 /100 | #10 | Exceptional 10.1% |
| Iranians | 100.0 /100 | #11 | Exceptional 10.1% |
| Immigrants | Israel | 100.0 /100 | #12 | Exceptional 10.1% |
| Immigrants | Eastern Asia | 100.0 /100 | #13 | Exceptional 10.2% |
| Immigrants | Korea | 100.0 /100 | #14 | Exceptional 10.2% |
| Okinawans | 100.0 /100 | #15 | Exceptional 10.3% |
| Indians (Asian) | 100.0 /100 | #16 | Exceptional 10.3% |
| Immigrants | Iran | 100.0 /100 | #17 | Exceptional 10.3% |
| Burmese | 100.0 /100 | #18 | Exceptional 10.4% |
| Immigrants | Pakistan | 100.0 /100 | #19 | Exceptional 10.4% |
| Immigrants | Venezuela | 100.0 /100 | #20 | Exceptional 10.4% |
| Asians | 100.0 /100 | #21 | Exceptional 10.4% |
| Immigrants | Sri Lanka | 100.0 /100 | #22 | Exceptional 10.5% |