Immigrants from Bulgaria vs Okinawan Single Father Poverty
COMPARE
Immigrants from Bulgaria
Okinawan
Single Father Poverty
Single Father Poverty Comparison
Immigrants from Bulgaria
Okinawans
15.0%
SINGLE FATHER POVERTY
99.9/ 100
METRIC RATING
55th/ 347
METRIC RANK
14.6%
SINGLE FATHER POVERTY
100.0/ 100
METRIC RATING
33rd/ 347
METRIC RANK
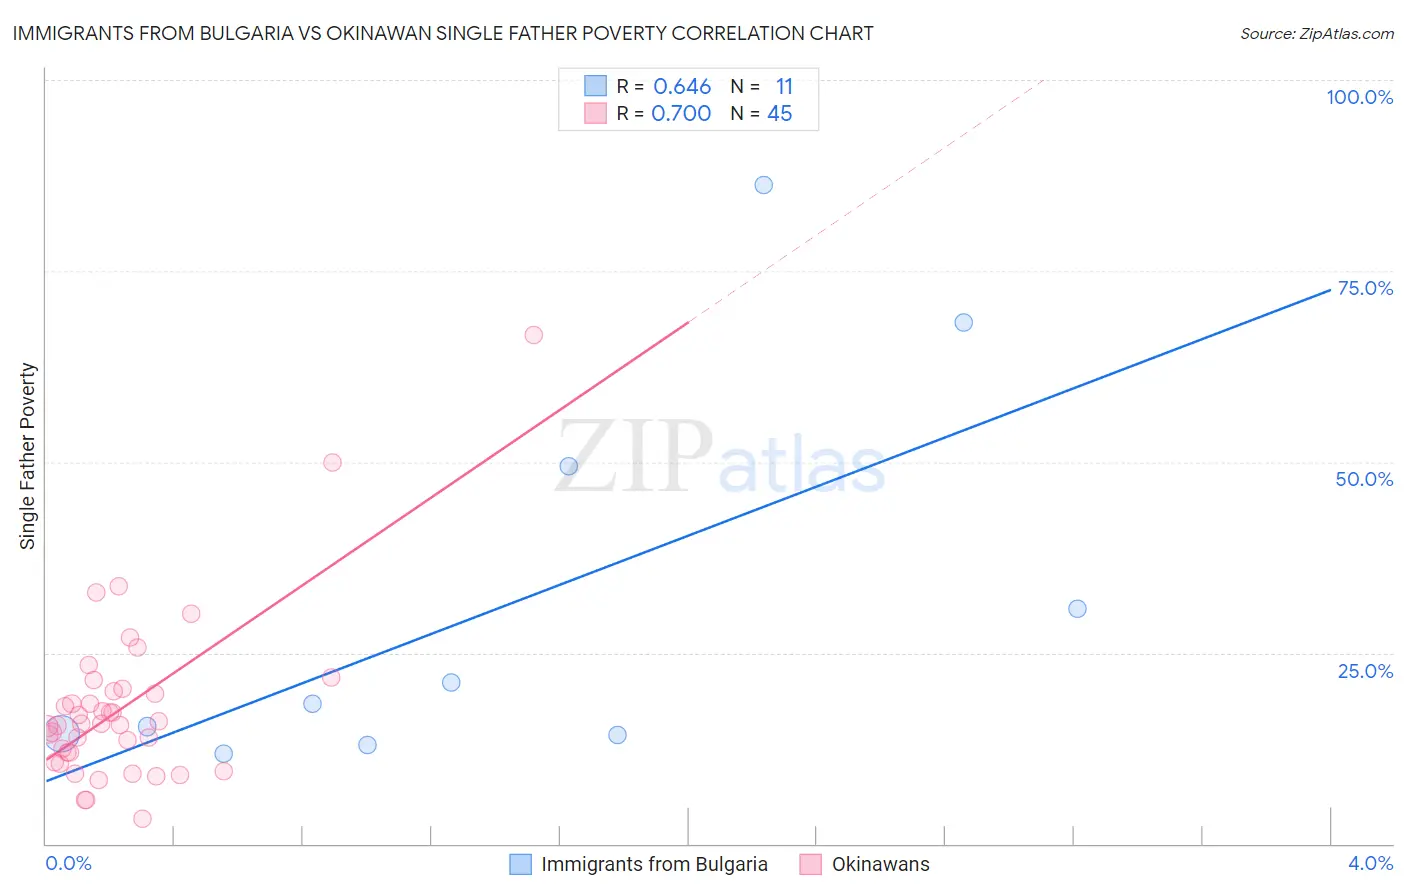
Immigrants from Bulgaria vs Okinawan Single Father Poverty Correlation Chart
The statistical analysis conducted on geographies consisting of 145,942,181 people shows a significant positive correlation between the proportion of Immigrants from Bulgaria and poverty level among single fathers in the United States with a correlation coefficient (R) of 0.646 and weighted average of 15.0%. Similarly, the statistical analysis conducted on geographies consisting of 67,888,416 people shows a strong positive correlation between the proportion of Okinawans and poverty level among single fathers in the United States with a correlation coefficient (R) of 0.700 and weighted average of 14.6%, a difference of 2.6%.
Single Father Poverty Correlation Summary
| Measurement | Immigrants from Bulgaria | Okinawan |
| Minimum | 11.8% | 3.3% |
| Maximum | 86.2% | 66.7% |
| Range | 74.4% | 63.4% |
| Mean | 31.2% | 17.9% |
| Median | 18.3% | 15.8% |
| Interquartile 25% (IQ1) | 14.3% | 11.3% |
| Interquartile 75% (IQ3) | 49.4% | 20.1% |
| Interquartile Range (IQR) | 35.1% | 8.8% |
| Standard Deviation (Sample) | 25.5% | 11.2% |
| Standard Deviation (Population) | 24.4% | 11.1% |
Similar Demographics by Single Father Poverty
Demographics Similar to Immigrants from Bulgaria by Single Father Poverty
In terms of single father poverty, the demographic groups most similar to Immigrants from Bulgaria are Immigrants from Uzbekistan (15.0%, a difference of 0.050%), Immigrants from Kenya (15.0%, a difference of 0.23%), Immigrants from El Salvador (15.0%, a difference of 0.26%), Immigrants from Laos (15.1%, a difference of 0.28%), and Immigrants from Pakistan (15.0%, a difference of 0.30%).
| Demographics | Rating | Rank | Single Father Poverty |
| Malaysians | 99.9 /100 | #48 | Exceptional 14.9% |
| Immigrants | Eastern Asia | 99.9 /100 | #49 | Exceptional 15.0% |
| Bhutanese | 99.9 /100 | #50 | Exceptional 15.0% |
| Immigrants | Pakistan | 99.9 /100 | #51 | Exceptional 15.0% |
| Immigrants | El Salvador | 99.9 /100 | #52 | Exceptional 15.0% |
| Immigrants | Kenya | 99.9 /100 | #53 | Exceptional 15.0% |
| Immigrants | Uzbekistan | 99.9 /100 | #54 | Exceptional 15.0% |
| Immigrants | Bulgaria | 99.9 /100 | #55 | Exceptional 15.0% |
| Immigrants | Laos | 99.9 /100 | #56 | Exceptional 15.1% |
| Laotians | 99.9 /100 | #57 | Exceptional 15.1% |
| Hawaiians | 99.9 /100 | #58 | Exceptional 15.1% |
| Guamanians/Chamorros | 99.9 /100 | #59 | Exceptional 15.1% |
| Puget Sound Salish | 99.8 /100 | #60 | Exceptional 15.2% |
| Immigrants | Bosnia and Herzegovina | 99.8 /100 | #61 | Exceptional 15.2% |
| Immigrants | Armenia | 99.8 /100 | #62 | Exceptional 15.2% |
Demographics Similar to Okinawans by Single Father Poverty
In terms of single father poverty, the demographic groups most similar to Okinawans are Egyptian (14.7%, a difference of 0.10%), Immigrants from Bolivia (14.7%, a difference of 0.17%), Immigrants from Indonesia (14.7%, a difference of 0.33%), Immigrants from Eastern Africa (14.7%, a difference of 0.46%), and Bolivian (14.7%, a difference of 0.47%).
| Demographics | Rating | Rank | Single Father Poverty |
| Spanish American Indians | 100.0 /100 | #26 | Exceptional 14.4% |
| Nepalese | 100.0 /100 | #27 | Exceptional 14.4% |
| Immigrants | South Central Asia | 100.0 /100 | #28 | Exceptional 14.5% |
| Somalis | 100.0 /100 | #29 | Exceptional 14.5% |
| Thais | 100.0 /100 | #30 | Exceptional 14.5% |
| Icelanders | 100.0 /100 | #31 | Exceptional 14.5% |
| Asians | 100.0 /100 | #32 | Exceptional 14.6% |
| Okinawans | 100.0 /100 | #33 | Exceptional 14.6% |
| Egyptians | 100.0 /100 | #34 | Exceptional 14.7% |
| Immigrants | Bolivia | 100.0 /100 | #35 | Exceptional 14.7% |
| Immigrants | Indonesia | 100.0 /100 | #36 | Exceptional 14.7% |
| Immigrants | Eastern Africa | 100.0 /100 | #37 | Exceptional 14.7% |
| Bolivians | 100.0 /100 | #38 | Exceptional 14.7% |
| Immigrants | Asia | 100.0 /100 | #39 | Exceptional 14.7% |
| Pima | 100.0 /100 | #40 | Exceptional 14.8% |