Immigrants from Eastern Europe vs Okinawan Disability
COMPARE
Immigrants from Eastern Europe
Okinawan
Disability
Disability Comparison
Immigrants from Eastern Europe
Okinawans
11.3%
DISABILITY
96.3/ 100
METRIC RATING
106th/ 347
METRIC RANK
10.3%
DISABILITY
100.0/ 100
METRIC RATING
15th/ 347
METRIC RANK
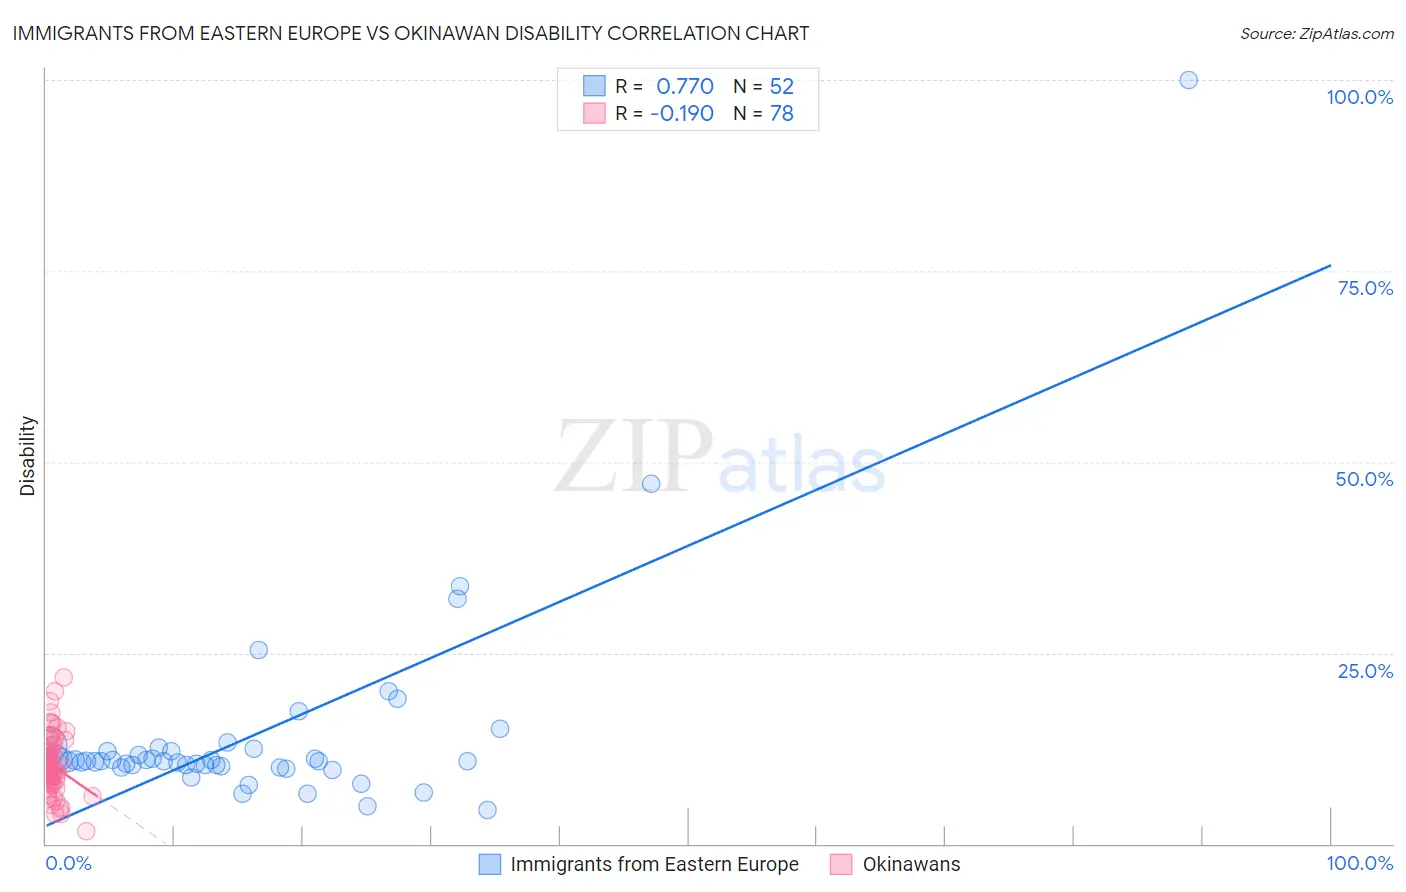
Immigrants from Eastern Europe vs Okinawan Disability Correlation Chart
The statistical analysis conducted on geographies consisting of 475,819,373 people shows a strong positive correlation between the proportion of Immigrants from Eastern Europe and percentage of population with a disability in the United States with a correlation coefficient (R) of 0.770 and weighted average of 11.3%. Similarly, the statistical analysis conducted on geographies consisting of 73,770,333 people shows a poor negative correlation between the proportion of Okinawans and percentage of population with a disability in the United States with a correlation coefficient (R) of -0.190 and weighted average of 10.3%, a difference of 10.0%.
Disability Correlation Summary
| Measurement | Immigrants from Eastern Europe | Okinawan |
| Minimum | 4.4% | 1.6% |
| Maximum | 100.0% | 21.8% |
| Range | 95.6% | 20.2% |
| Mean | 14.4% | 10.3% |
| Median | 10.8% | 9.6% |
| Interquartile 25% (IQ1) | 10.2% | 8.6% |
| Interquartile 75% (IQ3) | 12.3% | 11.9% |
| Interquartile Range (IQR) | 2.1% | 3.3% |
| Standard Deviation (Sample) | 14.1% | 3.6% |
| Standard Deviation (Population) | 14.0% | 3.6% |
Similar Demographics by Disability
Demographics Similar to Immigrants from Eastern Europe by Disability
In terms of disability, the demographic groups most similar to Immigrants from Eastern Europe are Nicaraguan (11.3%, a difference of 0.020%), Immigrants from Kazakhstan (11.3%, a difference of 0.030%), Immigrants from Uruguay (11.3%, a difference of 0.040%), Immigrants (11.3%, a difference of 0.040%), and Immigrants from Nigeria (11.3%, a difference of 0.10%).
| Demographics | Rating | Rank | Disability |
| Immigrants | Czechoslovakia | 97.4 /100 | #99 | Exceptional 11.2% |
| Immigrants | Greece | 96.9 /100 | #100 | Exceptional 11.3% |
| Immigrants | Nicaragua | 96.8 /100 | #101 | Exceptional 11.3% |
| Immigrants | Eastern Africa | 96.7 /100 | #102 | Exceptional 11.3% |
| Immigrants | Uruguay | 96.4 /100 | #103 | Exceptional 11.3% |
| Immigrants | Immigrants | 96.4 /100 | #104 | Exceptional 11.3% |
| Immigrants | Kazakhstan | 96.4 /100 | #105 | Exceptional 11.3% |
| Immigrants | Eastern Europe | 96.3 /100 | #106 | Exceptional 11.3% |
| Nicaraguans | 96.2 /100 | #107 | Exceptional 11.3% |
| Immigrants | Nigeria | 96.0 /100 | #108 | Exceptional 11.3% |
| Immigrants | Uganda | 95.7 /100 | #109 | Exceptional 11.3% |
| Immigrants | Denmark | 95.6 /100 | #110 | Exceptional 11.3% |
| Immigrants | South Eastern Asia | 95.4 /100 | #111 | Exceptional 11.3% |
| Immigrants | Uzbekistan | 94.9 /100 | #112 | Exceptional 11.3% |
| Guyanese | 94.7 /100 | #113 | Exceptional 11.3% |
Demographics Similar to Okinawans by Disability
In terms of disability, the demographic groups most similar to Okinawans are Indian (Asian) (10.3%, a difference of 0.070%), Immigrants from Iran (10.3%, a difference of 0.13%), Immigrants from Korea (10.2%, a difference of 0.31%), Immigrants from Eastern Asia (10.2%, a difference of 0.91%), and Immigrants from Israel (10.1%, a difference of 1.1%).
| Demographics | Rating | Rank | Disability |
| Bolivians | 100.0 /100 | #8 | Exceptional 10.0% |
| Immigrants | Hong Kong | 100.0 /100 | #9 | Exceptional 10.0% |
| Immigrants | China | 100.0 /100 | #10 | Exceptional 10.1% |
| Iranians | 100.0 /100 | #11 | Exceptional 10.1% |
| Immigrants | Israel | 100.0 /100 | #12 | Exceptional 10.1% |
| Immigrants | Eastern Asia | 100.0 /100 | #13 | Exceptional 10.2% |
| Immigrants | Korea | 100.0 /100 | #14 | Exceptional 10.2% |
| Okinawans | 100.0 /100 | #15 | Exceptional 10.3% |
| Indians (Asian) | 100.0 /100 | #16 | Exceptional 10.3% |
| Immigrants | Iran | 100.0 /100 | #17 | Exceptional 10.3% |
| Burmese | 100.0 /100 | #18 | Exceptional 10.4% |
| Immigrants | Pakistan | 100.0 /100 | #19 | Exceptional 10.4% |
| Immigrants | Venezuela | 100.0 /100 | #20 | Exceptional 10.4% |
| Asians | 100.0 /100 | #21 | Exceptional 10.4% |
| Immigrants | Sri Lanka | 100.0 /100 | #22 | Exceptional 10.5% |