Immigrants from Panama vs Arab Hearing Disability
COMPARE
Immigrants from Panama
Arab
Hearing Disability
Hearing Disability Comparison
Immigrants from Panama
Arabs
2.9%
HEARING DISABILITY
76.9/ 100
METRIC RATING
149th/ 347
METRIC RANK
3.0%
HEARING DISABILITY
57.6/ 100
METRIC RATING
169th/ 347
METRIC RANK
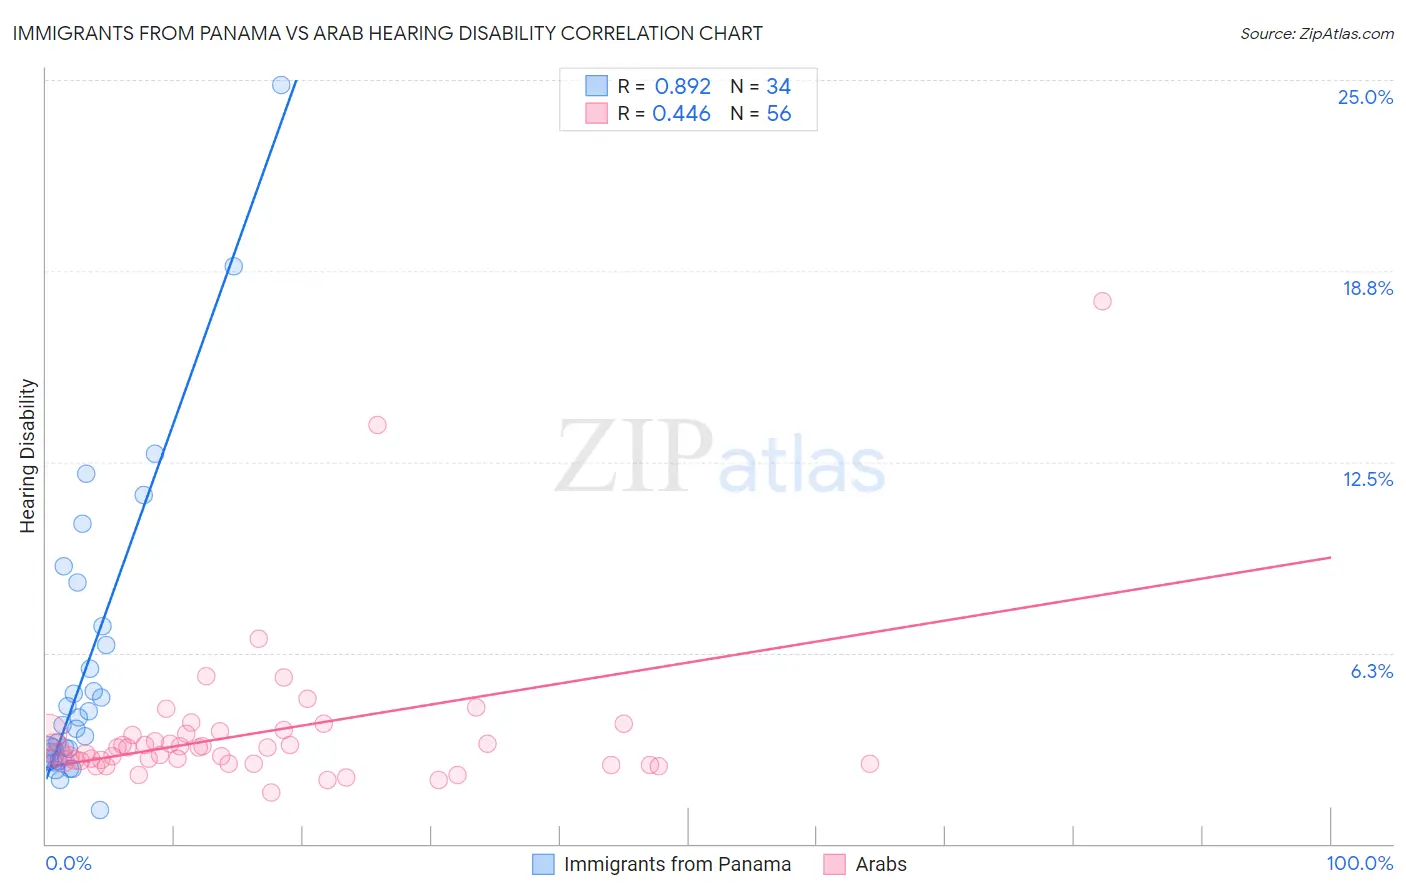
Immigrants from Panama vs Arab Hearing Disability Correlation Chart
The statistical analysis conducted on geographies consisting of 221,167,736 people shows a very strong positive correlation between the proportion of Immigrants from Panama and percentage of population with hearing disability in the United States with a correlation coefficient (R) of 0.892 and weighted average of 2.9%. Similarly, the statistical analysis conducted on geographies consisting of 486,579,834 people shows a moderate positive correlation between the proportion of Arabs and percentage of population with hearing disability in the United States with a correlation coefficient (R) of 0.446 and weighted average of 3.0%, a difference of 2.2%.
Hearing Disability Correlation Summary
| Measurement | Immigrants from Panama | Arab |
| Minimum | 1.1% | 1.7% |
| Maximum | 24.8% | 17.8% |
| Range | 23.7% | 16.1% |
| Mean | 6.0% | 3.6% |
| Median | 4.0% | 3.1% |
| Interquartile 25% (IQ1) | 3.0% | 2.7% |
| Interquartile 75% (IQ3) | 7.1% | 3.6% |
| Interquartile Range (IQR) | 4.1% | 0.96% |
| Standard Deviation (Sample) | 5.1% | 2.5% |
| Standard Deviation (Population) | 5.0% | 2.5% |
Demographics Similar to Immigrants from Panama and Arabs by Hearing Disability
In terms of hearing disability, the demographic groups most similar to Immigrants from Panama are Palestinian (2.9%, a difference of 0.42%), Immigrants from France (2.9%, a difference of 0.49%), Immigrants from Lithuania (2.9%, a difference of 0.50%), Sudanese (2.9%, a difference of 0.60%), and Immigrants from Lebanon (2.9%, a difference of 0.68%). Similarly, the demographic groups most similar to Arabs are Immigrants from Greece (3.0%, a difference of 0.030%), Immigrants from Eastern Europe (3.0%, a difference of 0.040%), Immigrants from South Eastern Asia (3.0%, a difference of 0.52%), Immigrants from Zimbabwe (3.0%, a difference of 0.66%), and Immigrants from Cambodia (3.0%, a difference of 0.72%).
| Demographics | Rating | Rank | Hearing Disability |
| Immigrants | Panama | 76.9 /100 | #149 | Good 2.9% |
| Palestinians | 73.6 /100 | #150 | Good 2.9% |
| Immigrants | France | 73.1 /100 | #151 | Good 2.9% |
| Immigrants | Lithuania | 73.0 /100 | #152 | Good 2.9% |
| Sudanese | 72.1 /100 | #153 | Good 2.9% |
| Immigrants | Lebanon | 71.5 /100 | #154 | Good 2.9% |
| Costa Ricans | 71.4 /100 | #155 | Good 2.9% |
| Immigrants | Poland | 70.2 /100 | #156 | Good 2.9% |
| Immigrants | Kazakhstan | 69.6 /100 | #157 | Good 2.9% |
| Immigrants | Burma/Myanmar | 69.5 /100 | #158 | Good 2.9% |
| Immigrants | Australia | 67.4 /100 | #159 | Good 2.9% |
| Immigrants | Fiji | 67.1 /100 | #160 | Good 2.9% |
| Albanians | 66.6 /100 | #161 | Good 2.9% |
| Immigrants | Japan | 66.3 /100 | #162 | Good 2.9% |
| Immigrants | Central America | 64.9 /100 | #163 | Good 3.0% |
| Immigrants | Cambodia | 64.8 /100 | #164 | Good 3.0% |
| Immigrants | Zimbabwe | 64.2 /100 | #165 | Good 3.0% |
| Immigrants | South Eastern Asia | 62.9 /100 | #166 | Good 3.0% |
| Immigrants | Eastern Europe | 58.1 /100 | #167 | Average 3.0% |
| Immigrants | Greece | 57.9 /100 | #168 | Average 3.0% |
| Arabs | 57.6 /100 | #169 | Average 3.0% |