Immigrants from Bolivia vs Ukrainian Male Disability
COMPARE
Immigrants from Bolivia
Ukrainian
Male Disability
Male Disability Comparison
Immigrants from Bolivia
Ukrainians
9.5%
MALE DISABILITY
100.0/ 100
METRIC RATING
7th/ 347
METRIC RANK
11.5%
MALE DISABILITY
10.6/ 100
METRIC RATING
206th/ 347
METRIC RANK
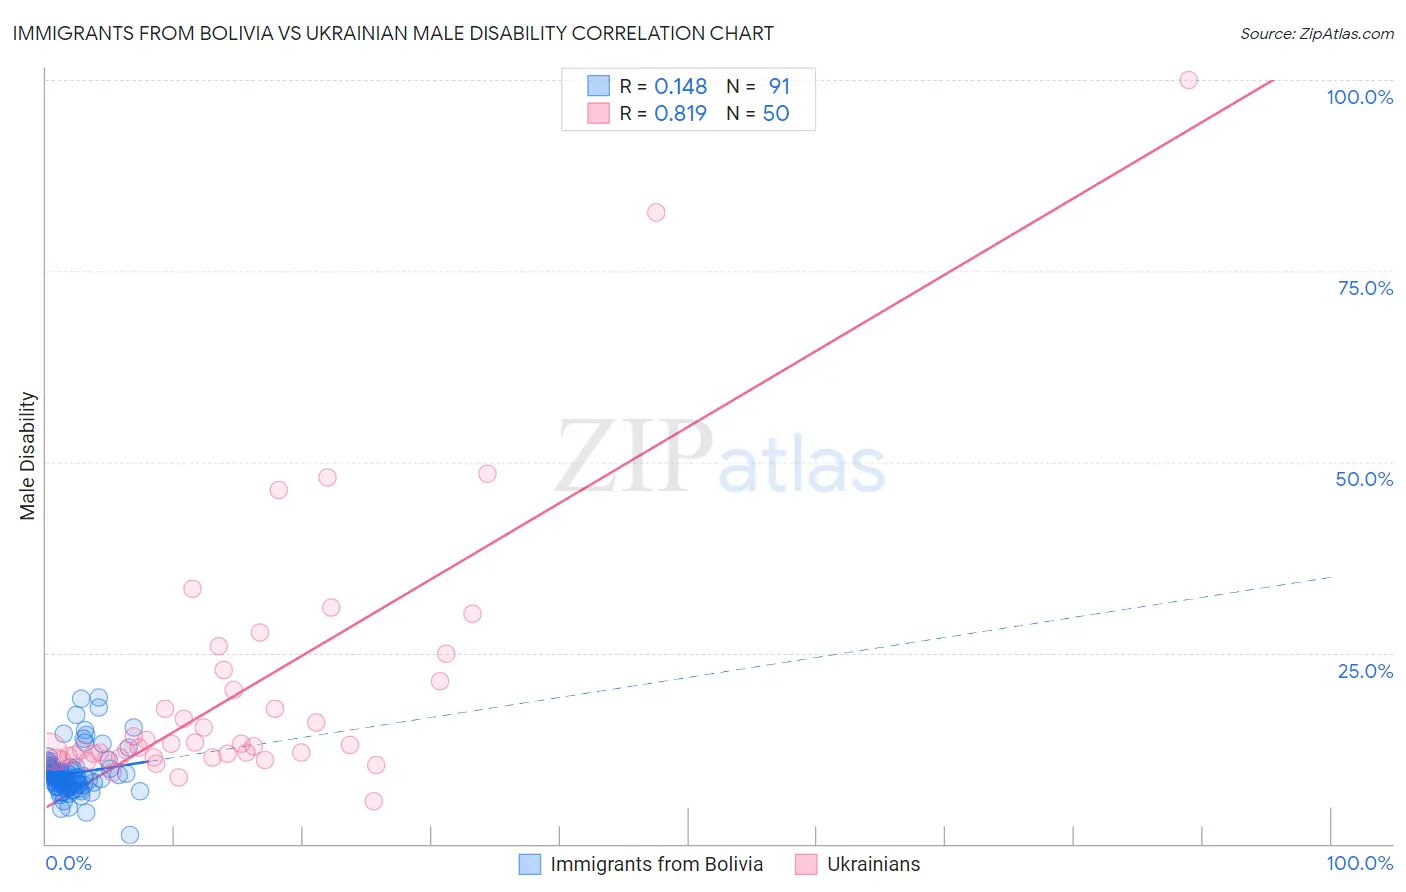
Immigrants from Bolivia vs Ukrainian Male Disability Correlation Chart
The statistical analysis conducted on geographies consisting of 158,713,247 people shows a poor positive correlation between the proportion of Immigrants from Bolivia and percentage of males with a disability in the United States with a correlation coefficient (R) of 0.148 and weighted average of 9.5%. Similarly, the statistical analysis conducted on geographies consisting of 448,602,749 people shows a very strong positive correlation between the proportion of Ukrainians and percentage of males with a disability in the United States with a correlation coefficient (R) of 0.819 and weighted average of 11.5%, a difference of 22.0%.
Male Disability Correlation Summary
| Measurement | Immigrants from Bolivia | Ukrainian |
| Minimum | 1.2% | 5.6% |
| Maximum | 19.2% | 100.0% |
| Range | 18.0% | 94.4% |
| Mean | 9.2% | 20.0% |
| Median | 8.8% | 12.8% |
| Interquartile 25% (IQ1) | 7.7% | 11.3% |
| Interquartile 75% (IQ3) | 9.9% | 21.2% |
| Interquartile Range (IQR) | 2.2% | 9.9% |
| Standard Deviation (Sample) | 3.0% | 17.8% |
| Standard Deviation (Population) | 3.0% | 17.6% |
Similar Demographics by Male Disability
Demographics Similar to Immigrants from Bolivia by Male Disability
In terms of male disability, the demographic groups most similar to Immigrants from Bolivia are Immigrants from South Central Asia (9.4%, a difference of 0.33%), Immigrants from Hong Kong (9.4%, a difference of 0.39%), Immigrants from China (9.5%, a difference of 0.60%), Immigrants from Singapore (9.5%, a difference of 0.68%), and Immigrants from Israel (9.6%, a difference of 1.1%).
| Demographics | Rating | Rank | Male Disability |
| Immigrants | India | 100.0 /100 | #1 | Exceptional 9.0% |
| Immigrants | Taiwan | 100.0 /100 | #2 | Exceptional 9.1% |
| Filipinos | 100.0 /100 | #3 | Exceptional 9.1% |
| Thais | 100.0 /100 | #4 | Exceptional 9.2% |
| Immigrants | Hong Kong | 100.0 /100 | #5 | Exceptional 9.4% |
| Immigrants | South Central Asia | 100.0 /100 | #6 | Exceptional 9.4% |
| Immigrants | Bolivia | 100.0 /100 | #7 | Exceptional 9.5% |
| Immigrants | China | 100.0 /100 | #8 | Exceptional 9.5% |
| Immigrants | Singapore | 100.0 /100 | #9 | Exceptional 9.5% |
| Immigrants | Israel | 100.0 /100 | #10 | Exceptional 9.6% |
| Immigrants | Eastern Asia | 100.0 /100 | #11 | Exceptional 9.6% |
| Bolivians | 100.0 /100 | #12 | Exceptional 9.6% |
| Iranians | 100.0 /100 | #13 | Exceptional 9.7% |
| Immigrants | Iran | 100.0 /100 | #14 | Exceptional 9.7% |
| Indians (Asian) | 100.0 /100 | #15 | Exceptional 9.7% |
Demographics Similar to Ukrainians by Male Disability
In terms of male disability, the demographic groups most similar to Ukrainians are Immigrants from Cambodia (11.5%, a difference of 0.010%), Serbian (11.5%, a difference of 0.010%), Jamaican (11.5%, a difference of 0.030%), Immigrants from Somalia (11.5%, a difference of 0.030%), and Icelander (11.6%, a difference of 0.070%).
| Demographics | Rating | Rank | Male Disability |
| Lebanese | 15.4 /100 | #199 | Poor 11.5% |
| Immigrants | Iraq | 13.0 /100 | #200 | Poor 11.5% |
| Immigrants | Panama | 13.0 /100 | #201 | Poor 11.5% |
| Immigrants | Mexico | 12.6 /100 | #202 | Poor 11.5% |
| Jamaicans | 10.9 /100 | #203 | Poor 11.5% |
| Immigrants | Cambodia | 10.8 /100 | #204 | Poor 11.5% |
| Serbians | 10.7 /100 | #205 | Poor 11.5% |
| Ukrainians | 10.6 /100 | #206 | Poor 11.5% |
| Immigrants | Somalia | 10.4 /100 | #207 | Poor 11.5% |
| Icelanders | 10.1 /100 | #208 | Poor 11.6% |
| Spanish American Indians | 10.1 /100 | #209 | Poor 11.6% |
| Ute | 9.4 /100 | #210 | Tragic 11.6% |
| Immigrants | Thailand | 8.4 /100 | #211 | Tragic 11.6% |
| Immigrants | Scotland | 8.2 /100 | #212 | Tragic 11.6% |
| Mexican American Indians | 7.8 /100 | #213 | Tragic 11.6% |