Immigrants from Bolivia vs Filipino Male Disability
COMPARE
Immigrants from Bolivia
Filipino
Male Disability
Male Disability Comparison
Immigrants from Bolivia
Filipinos
9.5%
MALE DISABILITY
100.0/ 100
METRIC RATING
7th/ 347
METRIC RANK
9.1%
MALE DISABILITY
100.0/ 100
METRIC RATING
3rd/ 347
METRIC RANK
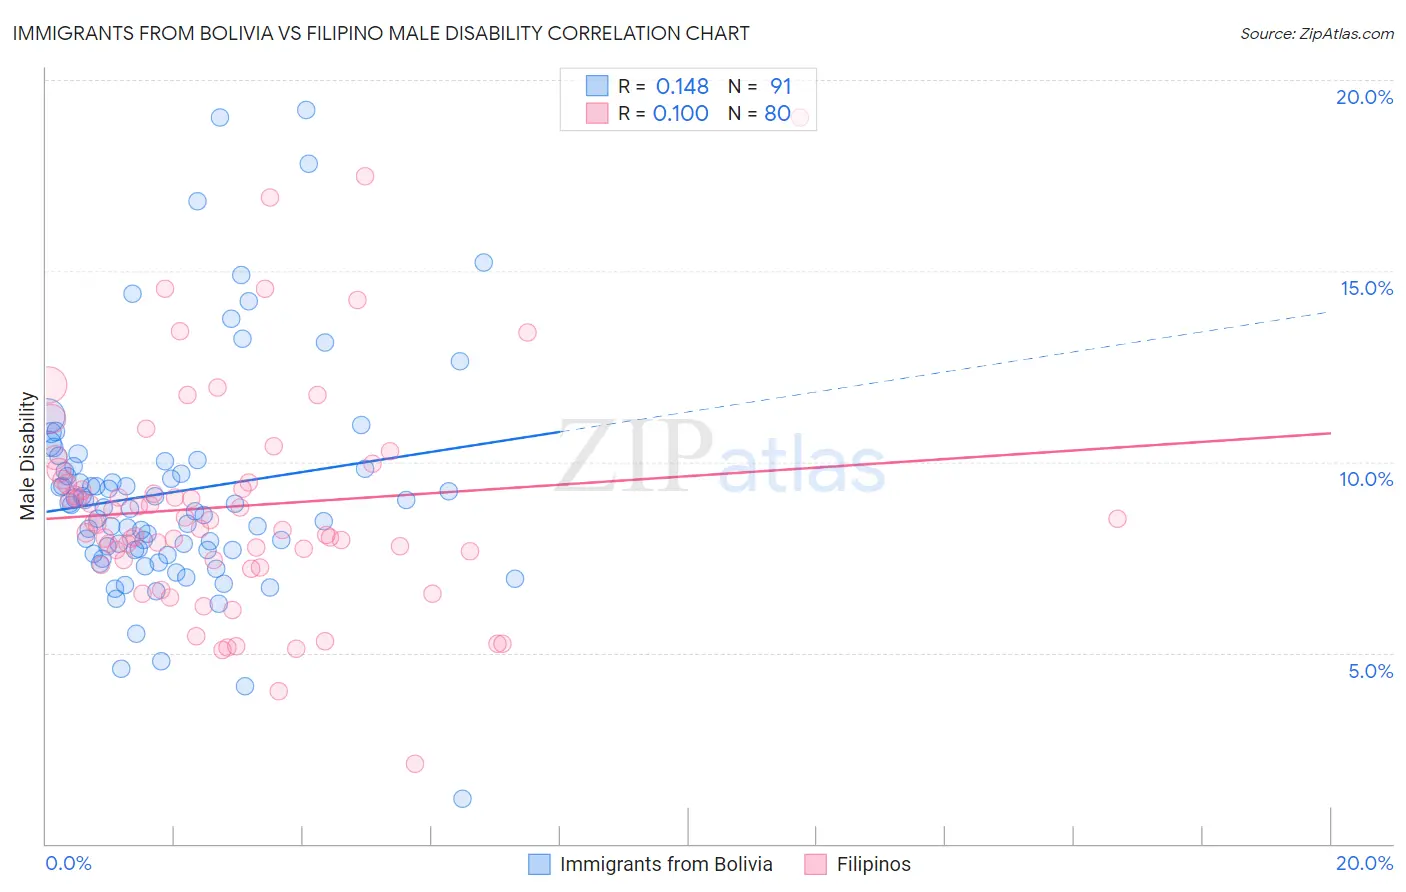
Immigrants from Bolivia vs Filipino Male Disability Correlation Chart
The statistical analysis conducted on geographies consisting of 158,713,247 people shows a poor positive correlation between the proportion of Immigrants from Bolivia and percentage of males with a disability in the United States with a correlation coefficient (R) of 0.148 and weighted average of 9.5%. Similarly, the statistical analysis conducted on geographies consisting of 254,333,979 people shows a poor positive correlation between the proportion of Filipinos and percentage of males with a disability in the United States with a correlation coefficient (R) of 0.100 and weighted average of 9.1%, a difference of 3.8%.
Male Disability Correlation Summary
| Measurement | Immigrants from Bolivia | Filipino |
| Minimum | 1.2% | 2.1% |
| Maximum | 19.2% | 19.0% |
| Range | 18.0% | 16.9% |
| Mean | 9.2% | 8.8% |
| Median | 8.8% | 8.4% |
| Interquartile 25% (IQ1) | 7.7% | 7.4% |
| Interquartile 75% (IQ3) | 9.9% | 9.5% |
| Interquartile Range (IQR) | 2.2% | 2.1% |
| Standard Deviation (Sample) | 3.0% | 2.9% |
| Standard Deviation (Population) | 3.0% | 2.9% |
Demographics Similar to Immigrants from Bolivia and Filipinos by Male Disability
In terms of male disability, the demographic groups most similar to Immigrants from Bolivia are Immigrants from South Central Asia (9.4%, a difference of 0.33%), Immigrants from Hong Kong (9.4%, a difference of 0.39%), Immigrants from China (9.5%, a difference of 0.60%), Immigrants from Singapore (9.5%, a difference of 0.68%), and Immigrants from Israel (9.6%, a difference of 1.1%). Similarly, the demographic groups most similar to Filipinos are Immigrants from Taiwan (9.1%, a difference of 0.010%), Immigrants from India (9.0%, a difference of 0.90%), Thai (9.2%, a difference of 1.3%), Immigrants from Hong Kong (9.4%, a difference of 3.4%), and Immigrants from South Central Asia (9.4%, a difference of 3.5%).
| Demographics | Rating | Rank | Male Disability |
| Immigrants | India | 100.0 /100 | #1 | Exceptional 9.0% |
| Immigrants | Taiwan | 100.0 /100 | #2 | Exceptional 9.1% |
| Filipinos | 100.0 /100 | #3 | Exceptional 9.1% |
| Thais | 100.0 /100 | #4 | Exceptional 9.2% |
| Immigrants | Hong Kong | 100.0 /100 | #5 | Exceptional 9.4% |
| Immigrants | South Central Asia | 100.0 /100 | #6 | Exceptional 9.4% |
| Immigrants | Bolivia | 100.0 /100 | #7 | Exceptional 9.5% |
| Immigrants | China | 100.0 /100 | #8 | Exceptional 9.5% |
| Immigrants | Singapore | 100.0 /100 | #9 | Exceptional 9.5% |
| Immigrants | Israel | 100.0 /100 | #10 | Exceptional 9.6% |
| Immigrants | Eastern Asia | 100.0 /100 | #11 | Exceptional 9.6% |
| Bolivians | 100.0 /100 | #12 | Exceptional 9.6% |
| Iranians | 100.0 /100 | #13 | Exceptional 9.7% |
| Immigrants | Iran | 100.0 /100 | #14 | Exceptional 9.7% |
| Indians (Asian) | 100.0 /100 | #15 | Exceptional 9.7% |
| Okinawans | 100.0 /100 | #16 | Exceptional 9.8% |
| Immigrants | Korea | 100.0 /100 | #17 | Exceptional 9.8% |
| Immigrants | Pakistan | 100.0 /100 | #18 | Exceptional 9.8% |
| Immigrants | Sri Lanka | 100.0 /100 | #19 | Exceptional 10.0% |
| Asians | 100.0 /100 | #20 | Exceptional 10.0% |