Immigrants from Belize vs Sierra Leonean Disability Age 5 to 17
COMPARE
Immigrants from Belize
Sierra Leonean
Disability Age 5 to 17
Disability Age 5 to 17 Comparison
Immigrants from Belize
Sierra Leoneans
5.4%
DISABILITY AGE 5 TO 17
91.7/ 100
METRIC RATING
135th/ 347
METRIC RANK
5.8%
DISABILITY AGE 5 TO 17
7.0/ 100
METRIC RATING
219th/ 347
METRIC RANK
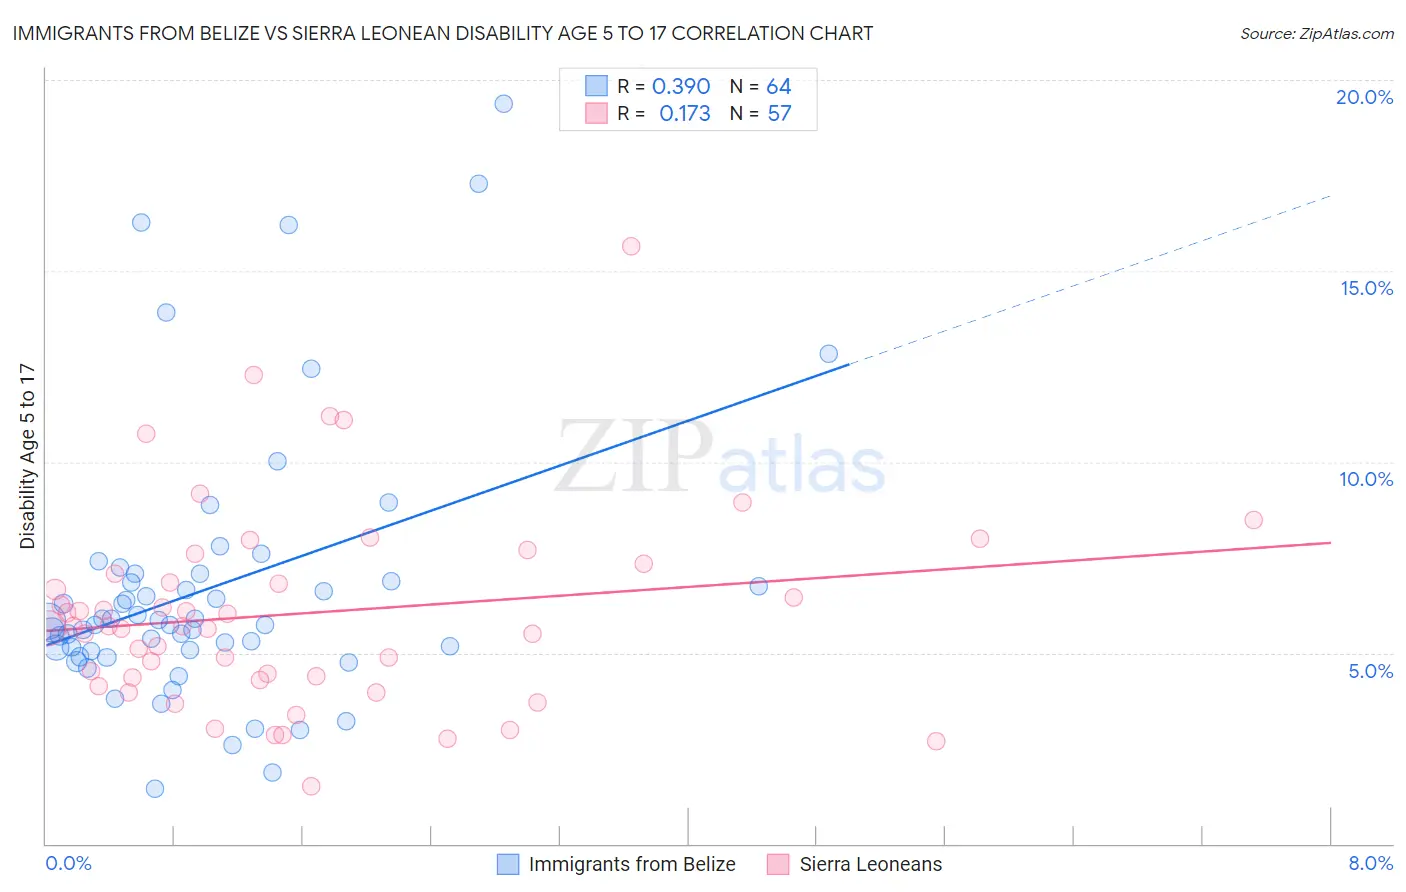
Immigrants from Belize vs Sierra Leonean Disability Age 5 to 17 Correlation Chart
The statistical analysis conducted on geographies consisting of 129,905,641 people shows a mild positive correlation between the proportion of Immigrants from Belize and percentage of population with a disability between the ages 5 and 17 in the United States with a correlation coefficient (R) of 0.390 and weighted average of 5.4%. Similarly, the statistical analysis conducted on geographies consisting of 83,260,070 people shows a poor positive correlation between the proportion of Sierra Leoneans and percentage of population with a disability between the ages 5 and 17 in the United States with a correlation coefficient (R) of 0.173 and weighted average of 5.8%, a difference of 6.3%.
Disability Age 5 to 17 Correlation Summary
| Measurement | Immigrants from Belize | Sierra Leonean |
| Minimum | 1.4% | 1.5% |
| Maximum | 19.4% | 15.7% |
| Range | 17.9% | 14.2% |
| Mean | 6.7% | 6.0% |
| Median | 5.8% | 5.7% |
| Interquartile 25% (IQ1) | 5.1% | 4.3% |
| Interquartile 75% (IQ3) | 7.0% | 7.2% |
| Interquartile Range (IQR) | 1.9% | 2.9% |
| Standard Deviation (Sample) | 3.5% | 2.6% |
| Standard Deviation (Population) | 3.5% | 2.6% |
Similar Demographics by Disability Age 5 to 17
Demographics Similar to Immigrants from Belize by Disability Age 5 to 17
In terms of disability age 5 to 17, the demographic groups most similar to Immigrants from Belize are Immigrants from Denmark (5.4%, a difference of 0.050%), Yuman (5.4%, a difference of 0.10%), Navajo (5.4%, a difference of 0.13%), Immigrants from Oceania (5.4%, a difference of 0.14%), and Belizean (5.4%, a difference of 0.14%).
| Demographics | Rating | Rank | Disability Age 5 to 17 |
| Immigrants | Venezuela | 94.5 /100 | #128 | Exceptional 5.4% |
| Romanians | 94.1 /100 | #129 | Exceptional 5.4% |
| Immigrants | Bulgaria | 94.0 /100 | #130 | Exceptional 5.4% |
| Arabs | 92.9 /100 | #131 | Exceptional 5.4% |
| Immigrants | Colombia | 92.9 /100 | #132 | Exceptional 5.4% |
| Venezuelans | 92.7 /100 | #133 | Exceptional 5.4% |
| Yuman | 92.3 /100 | #134 | Exceptional 5.4% |
| Immigrants | Belize | 91.7 /100 | #135 | Exceptional 5.4% |
| Immigrants | Denmark | 91.4 /100 | #136 | Exceptional 5.4% |
| Navajo | 90.9 /100 | #137 | Exceptional 5.4% |
| Immigrants | Oceania | 90.8 /100 | #138 | Exceptional 5.4% |
| Belizeans | 90.8 /100 | #139 | Exceptional 5.4% |
| Immigrants | Netherlands | 90.5 /100 | #140 | Exceptional 5.4% |
| South American Indians | 89.3 /100 | #141 | Excellent 5.5% |
| Colombians | 88.0 /100 | #142 | Excellent 5.5% |
Demographics Similar to Sierra Leoneans by Disability Age 5 to 17
In terms of disability age 5 to 17, the demographic groups most similar to Sierra Leoneans are Immigrants from Sierra Leone (5.8%, a difference of 0.010%), Belgian (5.8%, a difference of 0.010%), Lithuanian (5.8%, a difference of 0.050%), Czech (5.8%, a difference of 0.060%), and Immigrants from Sudan (5.8%, a difference of 0.060%).
| Demographics | Rating | Rank | Disability Age 5 to 17 |
| Immigrants | Panama | 8.7 /100 | #212 | Tragic 5.8% |
| Immigrants | Cameroon | 8.3 /100 | #213 | Tragic 5.8% |
| Immigrants | Morocco | 8.3 /100 | #214 | Tragic 5.8% |
| Swedes | 8.1 /100 | #215 | Tragic 5.8% |
| Nigerians | 7.5 /100 | #216 | Tragic 5.8% |
| Czechs | 7.4 /100 | #217 | Tragic 5.8% |
| Immigrants | Sierra Leone | 7.1 /100 | #218 | Tragic 5.8% |
| Sierra Leoneans | 7.0 /100 | #219 | Tragic 5.8% |
| Belgians | 6.9 /100 | #220 | Tragic 5.8% |
| Lithuanians | 6.7 /100 | #221 | Tragic 5.8% |
| Immigrants | Sudan | 6.7 /100 | #222 | Tragic 5.8% |
| Alsatians | 6.0 /100 | #223 | Tragic 5.8% |
| Mexicans | 5.7 /100 | #224 | Tragic 5.8% |
| Guamanians/Chamorros | 5.6 /100 | #225 | Tragic 5.8% |
| British West Indians | 5.4 /100 | #226 | Tragic 5.8% |