Immigrants from Bangladesh vs Immigrants from Brazil Disability
COMPARE
Immigrants from Bangladesh
Immigrants from Brazil
Disability
Disability Comparison
Immigrants from Bangladesh
Immigrants from Brazil
11.0%
DISABILITY
99.4/ 100
METRIC RATING
73rd/ 347
METRIC RANK
11.2%
DISABILITY
98.1/ 100
METRIC RATING
90th/ 347
METRIC RANK
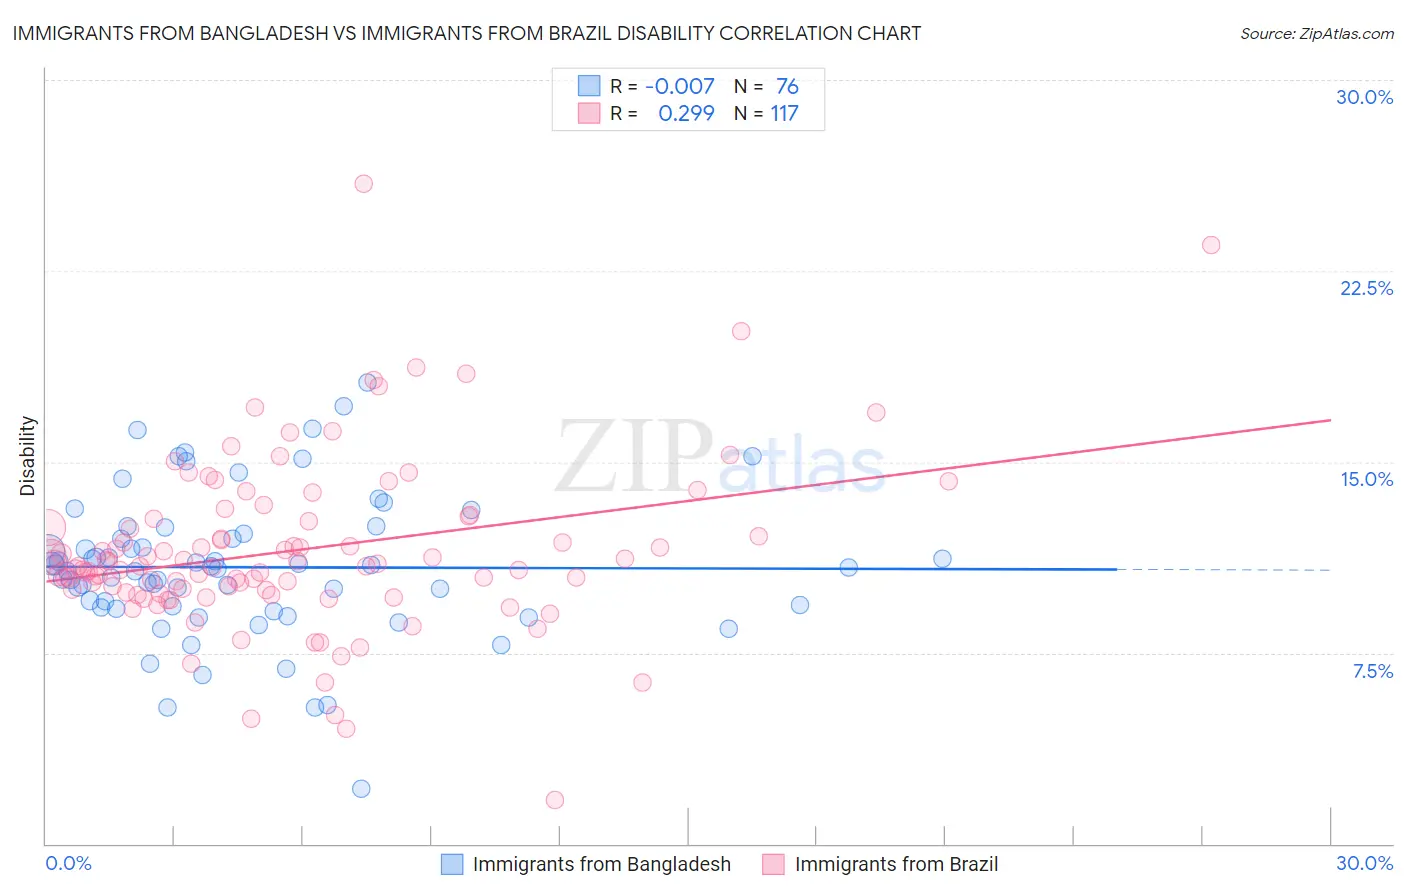
Immigrants from Bangladesh vs Immigrants from Brazil Disability Correlation Chart
The statistical analysis conducted on geographies consisting of 203,681,274 people shows no correlation between the proportion of Immigrants from Bangladesh and percentage of population with a disability in the United States with a correlation coefficient (R) of -0.007 and weighted average of 11.0%. Similarly, the statistical analysis conducted on geographies consisting of 343,011,527 people shows a weak positive correlation between the proportion of Immigrants from Brazil and percentage of population with a disability in the United States with a correlation coefficient (R) of 0.299 and weighted average of 11.2%, a difference of 1.3%.
Disability Correlation Summary
| Measurement | Immigrants from Bangladesh | Immigrants from Brazil |
| Minimum | 2.2% | 1.7% |
| Maximum | 18.1% | 25.9% |
| Range | 15.9% | 24.2% |
| Mean | 10.9% | 11.5% |
| Median | 10.8% | 10.9% |
| Interquartile 25% (IQ1) | 9.3% | 9.9% |
| Interquartile 75% (IQ3) | 12.1% | 12.7% |
| Interquartile Range (IQR) | 2.8% | 2.8% |
| Standard Deviation (Sample) | 2.8% | 3.4% |
| Standard Deviation (Population) | 2.8% | 3.4% |
Demographics Similar to Immigrants from Bangladesh and Immigrants from Brazil by Disability
In terms of disability, the demographic groups most similar to Immigrants from Bangladesh are Immigrants from Serbia (11.0%, a difference of 0.020%), Immigrants from Chile (11.0%, a difference of 0.030%), Immigrants from Vietnam (11.0%, a difference of 0.040%), Sierra Leonean (11.0%, a difference of 0.070%), and Immigrants from Belgium (11.0%, a difference of 0.070%). Similarly, the demographic groups most similar to Immigrants from Brazil are Immigrants from Western Asia (11.2%, a difference of 0.020%), Immigrants from South Africa (11.2%, a difference of 0.050%), Immigrants from Romania (11.2%, a difference of 0.30%), Palestinian (11.1%, a difference of 0.59%), and Immigrants from Belarus (11.1%, a difference of 0.63%).
| Demographics | Rating | Rank | Disability |
| Immigrants | Lebanon | 99.4 /100 | #71 | Exceptional 11.0% |
| Immigrants | Chile | 99.4 /100 | #72 | Exceptional 11.0% |
| Immigrants | Bangladesh | 99.4 /100 | #73 | Exceptional 11.0% |
| Immigrants | Serbia | 99.4 /100 | #74 | Exceptional 11.0% |
| Immigrants | Vietnam | 99.4 /100 | #75 | Exceptional 11.0% |
| Sierra Leoneans | 99.3 /100 | #76 | Exceptional 11.0% |
| Immigrants | Belgium | 99.3 /100 | #77 | Exceptional 11.0% |
| Immigrants | Cameroon | 99.3 /100 | #78 | Exceptional 11.1% |
| Immigrants | Jordan | 99.3 /100 | #79 | Exceptional 11.1% |
| Immigrants | Ireland | 99.3 /100 | #80 | Exceptional 11.1% |
| Immigrants | Poland | 99.1 /100 | #81 | Exceptional 11.1% |
| Chileans | 99.1 /100 | #82 | Exceptional 11.1% |
| Immigrants | Switzerland | 99.0 /100 | #83 | Exceptional 11.1% |
| Immigrants | Sierra Leone | 99.0 /100 | #84 | Exceptional 11.1% |
| Immigrants | Belarus | 98.9 /100 | #85 | Exceptional 11.1% |
| Immigrants | Russia | 98.9 /100 | #86 | Exceptional 11.1% |
| Palestinians | 98.9 /100 | #87 | Exceptional 11.1% |
| Immigrants | Romania | 98.5 /100 | #88 | Exceptional 11.2% |
| Immigrants | South Africa | 98.2 /100 | #89 | Exceptional 11.2% |
| Immigrants | Brazil | 98.1 /100 | #90 | Exceptional 11.2% |
| Immigrants | Western Asia | 98.1 /100 | #91 | Exceptional 11.2% |