Immigrants from Bangladesh vs Slavic Disability
COMPARE
Immigrants from Bangladesh
Slavic
Disability
Disability Comparison
Immigrants from Bangladesh
Slavs
11.0%
DISABILITY
99.4/ 100
METRIC RATING
73rd/ 347
METRIC RANK
12.4%
DISABILITY
0.5/ 100
METRIC RATING
258th/ 347
METRIC RANK
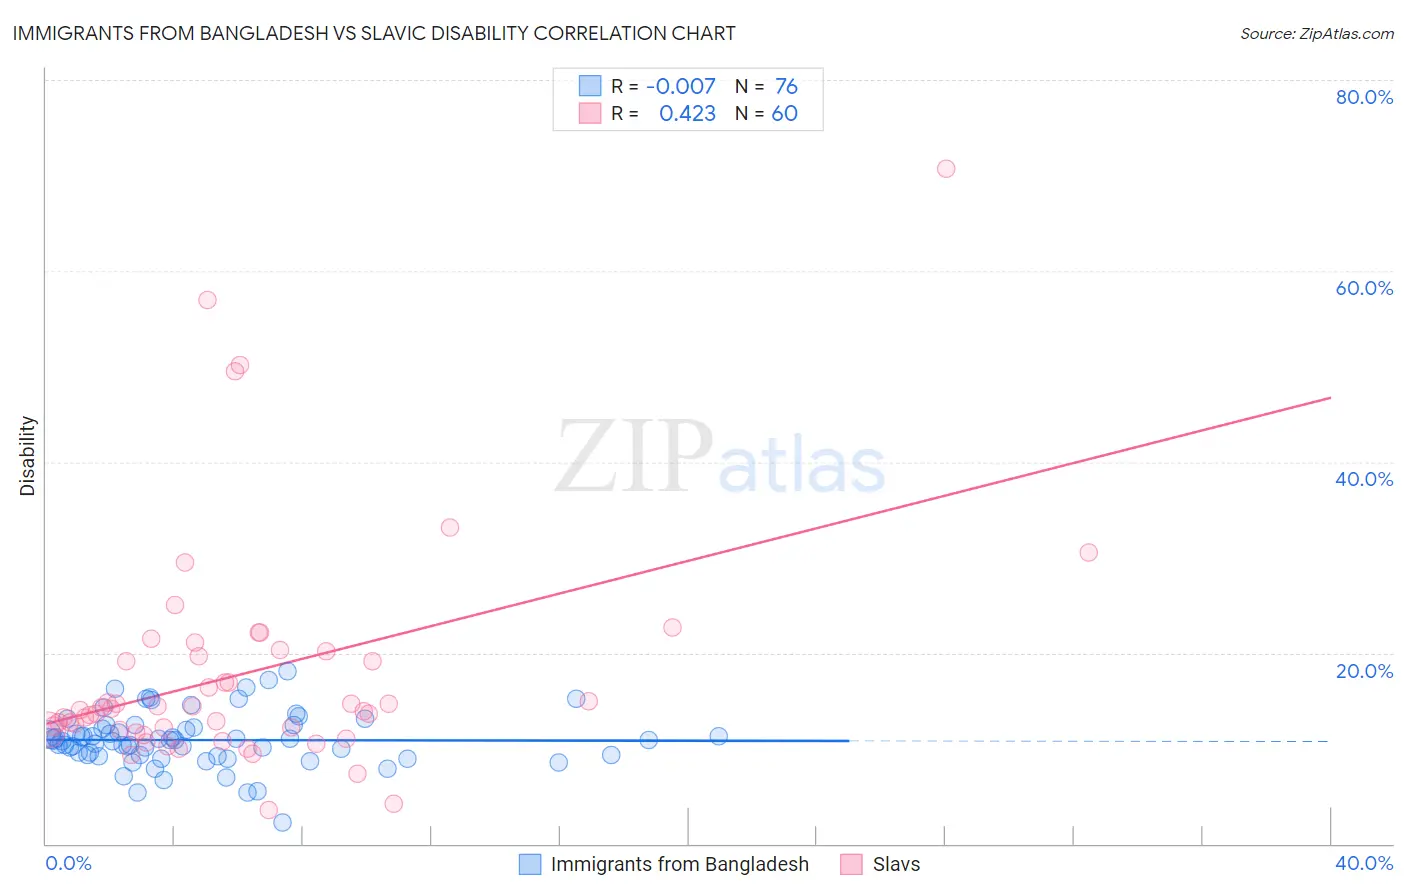
Immigrants from Bangladesh vs Slavic Disability Correlation Chart
The statistical analysis conducted on geographies consisting of 203,681,274 people shows no correlation between the proportion of Immigrants from Bangladesh and percentage of population with a disability in the United States with a correlation coefficient (R) of -0.007 and weighted average of 11.0%. Similarly, the statistical analysis conducted on geographies consisting of 270,861,742 people shows a moderate positive correlation between the proportion of Slavs and percentage of population with a disability in the United States with a correlation coefficient (R) of 0.423 and weighted average of 12.4%, a difference of 12.3%.
Disability Correlation Summary
| Measurement | Immigrants from Bangladesh | Slavic |
| Minimum | 2.2% | 3.5% |
| Maximum | 18.1% | 70.6% |
| Range | 15.9% | 67.1% |
| Mean | 10.9% | 17.8% |
| Median | 10.8% | 14.0% |
| Interquartile 25% (IQ1) | 9.3% | 11.9% |
| Interquartile 75% (IQ3) | 12.1% | 19.9% |
| Interquartile Range (IQR) | 2.8% | 7.9% |
| Standard Deviation (Sample) | 2.8% | 12.1% |
| Standard Deviation (Population) | 2.8% | 12.0% |
Similar Demographics by Disability
Demographics Similar to Immigrants from Bangladesh by Disability
In terms of disability, the demographic groups most similar to Immigrants from Bangladesh are Immigrants from Serbia (11.0%, a difference of 0.020%), Immigrants from Chile (11.0%, a difference of 0.030%), Immigrants from Vietnam (11.0%, a difference of 0.040%), Sierra Leonean (11.0%, a difference of 0.070%), and Immigrants from Belgium (11.0%, a difference of 0.070%).
| Demographics | Rating | Rank | Disability |
| Laotians | 99.6 /100 | #66 | Exceptional 11.0% |
| Colombians | 99.6 /100 | #67 | Exceptional 11.0% |
| Immigrants | Afghanistan | 99.6 /100 | #68 | Exceptional 11.0% |
| Sri Lankans | 99.5 /100 | #69 | Exceptional 11.0% |
| Immigrants | France | 99.4 /100 | #70 | Exceptional 11.0% |
| Immigrants | Lebanon | 99.4 /100 | #71 | Exceptional 11.0% |
| Immigrants | Chile | 99.4 /100 | #72 | Exceptional 11.0% |
| Immigrants | Bangladesh | 99.4 /100 | #73 | Exceptional 11.0% |
| Immigrants | Serbia | 99.4 /100 | #74 | Exceptional 11.0% |
| Immigrants | Vietnam | 99.4 /100 | #75 | Exceptional 11.0% |
| Sierra Leoneans | 99.3 /100 | #76 | Exceptional 11.0% |
| Immigrants | Belgium | 99.3 /100 | #77 | Exceptional 11.0% |
| Immigrants | Cameroon | 99.3 /100 | #78 | Exceptional 11.1% |
| Immigrants | Jordan | 99.3 /100 | #79 | Exceptional 11.1% |
| Immigrants | Ireland | 99.3 /100 | #80 | Exceptional 11.1% |
Demographics Similar to Slavs by Disability
In terms of disability, the demographic groups most similar to Slavs are Canadian (12.4%, a difference of 0.060%), Immigrants from Liberia (12.4%, a difference of 0.090%), Immigrants from Laos (12.4%, a difference of 0.14%), Scandinavian (12.4%, a difference of 0.16%), and Immigrants from Dominica (12.4%, a difference of 0.23%).
| Demographics | Rating | Rank | Disability |
| Europeans | 1.4 /100 | #251 | Tragic 12.3% |
| Bermudans | 1.1 /100 | #252 | Tragic 12.3% |
| Belgians | 0.8 /100 | #253 | Tragic 12.3% |
| German Russians | 0.8 /100 | #254 | Tragic 12.3% |
| Slovenes | 0.6 /100 | #255 | Tragic 12.4% |
| Immigrants | Dominica | 0.6 /100 | #256 | Tragic 12.4% |
| Immigrants | Laos | 0.5 /100 | #257 | Tragic 12.4% |
| Slavs | 0.5 /100 | #258 | Tragic 12.4% |
| Canadians | 0.4 /100 | #259 | Tragic 12.4% |
| Immigrants | Liberia | 0.4 /100 | #260 | Tragic 12.4% |
| Scandinavians | 0.4 /100 | #261 | Tragic 12.4% |
| Native Hawaiians | 0.3 /100 | #262 | Tragic 12.5% |
| Hawaiians | 0.2 /100 | #263 | Tragic 12.5% |
| Immigrants | Germany | 0.2 /100 | #264 | Tragic 12.5% |
| U.S. Virgin Islanders | 0.2 /100 | #265 | Tragic 12.5% |