Immigrants from Bangladesh vs Blackfeet Disability
COMPARE
Immigrants from Bangladesh
Blackfeet
Disability
Disability Comparison
Immigrants from Bangladesh
Blackfeet
11.0%
DISABILITY
99.4/ 100
METRIC RATING
73rd/ 347
METRIC RANK
13.6%
DISABILITY
0.0/ 100
METRIC RATING
310th/ 347
METRIC RANK
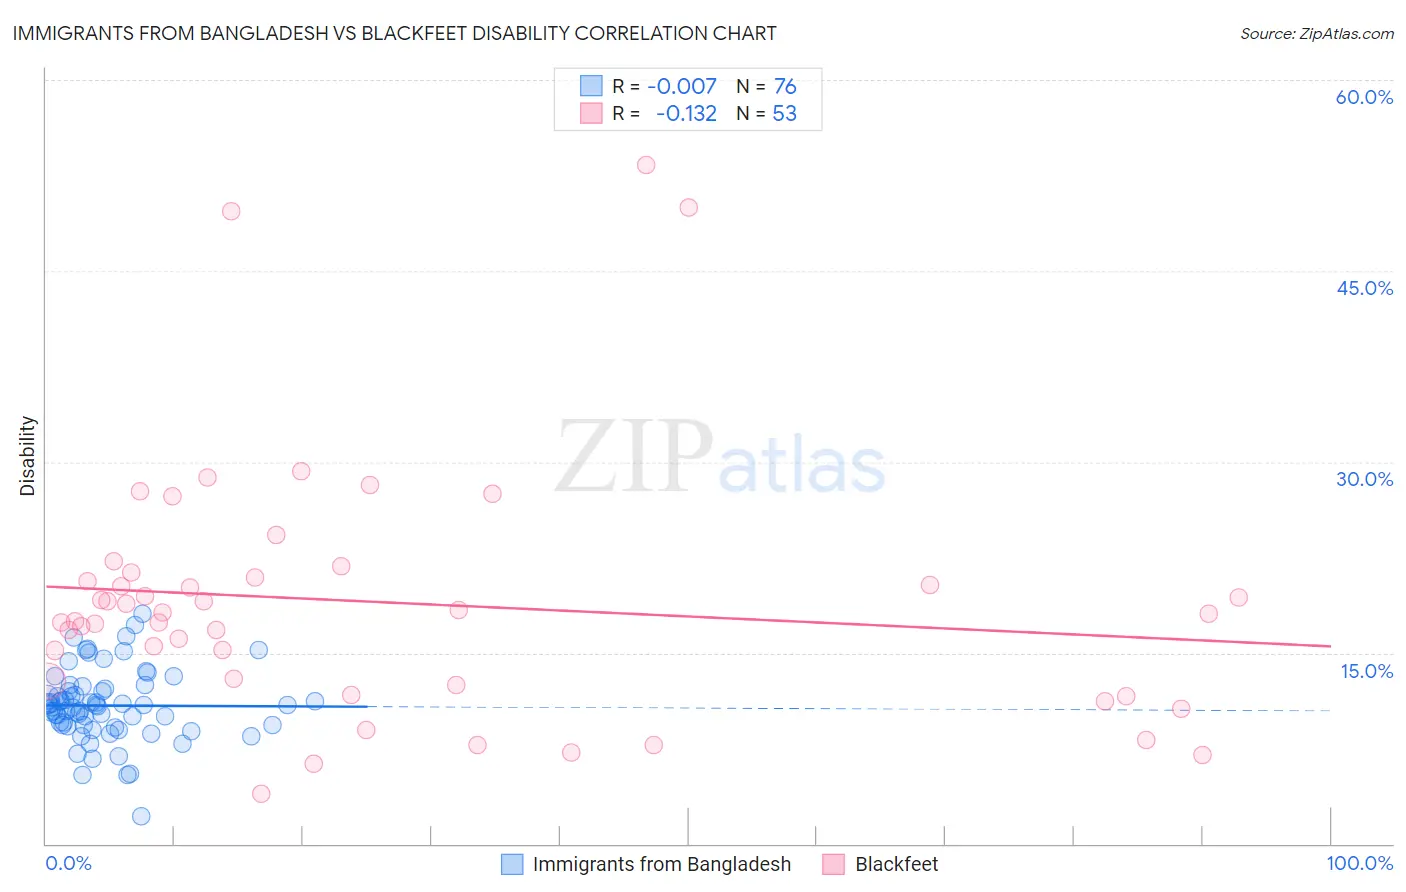
Immigrants from Bangladesh vs Blackfeet Disability Correlation Chart
The statistical analysis conducted on geographies consisting of 203,681,274 people shows no correlation between the proportion of Immigrants from Bangladesh and percentage of population with a disability in the United States with a correlation coefficient (R) of -0.007 and weighted average of 11.0%. Similarly, the statistical analysis conducted on geographies consisting of 309,516,327 people shows a poor negative correlation between the proportion of Blackfeet and percentage of population with a disability in the United States with a correlation coefficient (R) of -0.132 and weighted average of 13.6%, a difference of 23.3%.
Disability Correlation Summary
| Measurement | Immigrants from Bangladesh | Blackfeet |
| Minimum | 2.2% | 4.0% |
| Maximum | 18.1% | 53.3% |
| Range | 15.9% | 49.4% |
| Mean | 10.9% | 19.0% |
| Median | 10.8% | 18.1% |
| Interquartile 25% (IQ1) | 9.3% | 12.6% |
| Interquartile 75% (IQ3) | 12.1% | 21.1% |
| Interquartile Range (IQR) | 2.8% | 8.5% |
| Standard Deviation (Sample) | 2.8% | 10.0% |
| Standard Deviation (Population) | 2.8% | 9.9% |
Similar Demographics by Disability
Demographics Similar to Immigrants from Bangladesh by Disability
In terms of disability, the demographic groups most similar to Immigrants from Bangladesh are Immigrants from Serbia (11.0%, a difference of 0.020%), Immigrants from Chile (11.0%, a difference of 0.030%), Immigrants from Vietnam (11.0%, a difference of 0.040%), Sierra Leonean (11.0%, a difference of 0.070%), and Immigrants from Belgium (11.0%, a difference of 0.070%).
| Demographics | Rating | Rank | Disability |
| Laotians | 99.6 /100 | #66 | Exceptional 11.0% |
| Colombians | 99.6 /100 | #67 | Exceptional 11.0% |
| Immigrants | Afghanistan | 99.6 /100 | #68 | Exceptional 11.0% |
| Sri Lankans | 99.5 /100 | #69 | Exceptional 11.0% |
| Immigrants | France | 99.4 /100 | #70 | Exceptional 11.0% |
| Immigrants | Lebanon | 99.4 /100 | #71 | Exceptional 11.0% |
| Immigrants | Chile | 99.4 /100 | #72 | Exceptional 11.0% |
| Immigrants | Bangladesh | 99.4 /100 | #73 | Exceptional 11.0% |
| Immigrants | Serbia | 99.4 /100 | #74 | Exceptional 11.0% |
| Immigrants | Vietnam | 99.4 /100 | #75 | Exceptional 11.0% |
| Sierra Leoneans | 99.3 /100 | #76 | Exceptional 11.0% |
| Immigrants | Belgium | 99.3 /100 | #77 | Exceptional 11.0% |
| Immigrants | Cameroon | 99.3 /100 | #78 | Exceptional 11.1% |
| Immigrants | Jordan | 99.3 /100 | #79 | Exceptional 11.1% |
| Immigrants | Ireland | 99.3 /100 | #80 | Exceptional 11.1% |
Demographics Similar to Blackfeet by Disability
In terms of disability, the demographic groups most similar to Blackfeet are Delaware (13.6%, a difference of 0.040%), Spanish American (13.6%, a difference of 0.28%), Tlingit-Haida (13.5%, a difference of 0.53%), French American Indian (13.5%, a difference of 0.61%), and Cree (13.7%, a difference of 0.63%).
| Demographics | Rating | Rank | Disability |
| Scotch-Irish | 0.0 /100 | #303 | Tragic 13.3% |
| Yakama | 0.0 /100 | #304 | Tragic 13.4% |
| French Canadians | 0.0 /100 | #305 | Tragic 13.4% |
| Cape Verdeans | 0.0 /100 | #306 | Tragic 13.5% |
| Shoshone | 0.0 /100 | #307 | Tragic 13.5% |
| French American Indians | 0.0 /100 | #308 | Tragic 13.5% |
| Tlingit-Haida | 0.0 /100 | #309 | Tragic 13.5% |
| Blackfeet | 0.0 /100 | #310 | Tragic 13.6% |
| Delaware | 0.0 /100 | #311 | Tragic 13.6% |
| Spanish Americans | 0.0 /100 | #312 | Tragic 13.6% |
| Cree | 0.0 /100 | #313 | Tragic 13.7% |
| Blacks/African Americans | 0.0 /100 | #314 | Tragic 13.7% |
| Puget Sound Salish | 0.0 /100 | #315 | Tragic 13.7% |
| Pima | 0.0 /100 | #316 | Tragic 13.7% |
| Immigrants | Cabo Verde | 0.0 /100 | #317 | Tragic 13.7% |