Immigrants from Bahamas vs Yugoslavian Disability Age Under 5
COMPARE
Immigrants from Bahamas
Yugoslavian
Disability Age Under 5
Disability Age Under 5 Comparison
Immigrants from Bahamas
Yugoslavians
1.2%
DISABILITY AGE UNDER 5
45.2/ 100
METRIC RATING
179th/ 347
METRIC RANK
1.4%
DISABILITY AGE UNDER 5
0.1/ 100
METRIC RATING
264th/ 347
METRIC RANK
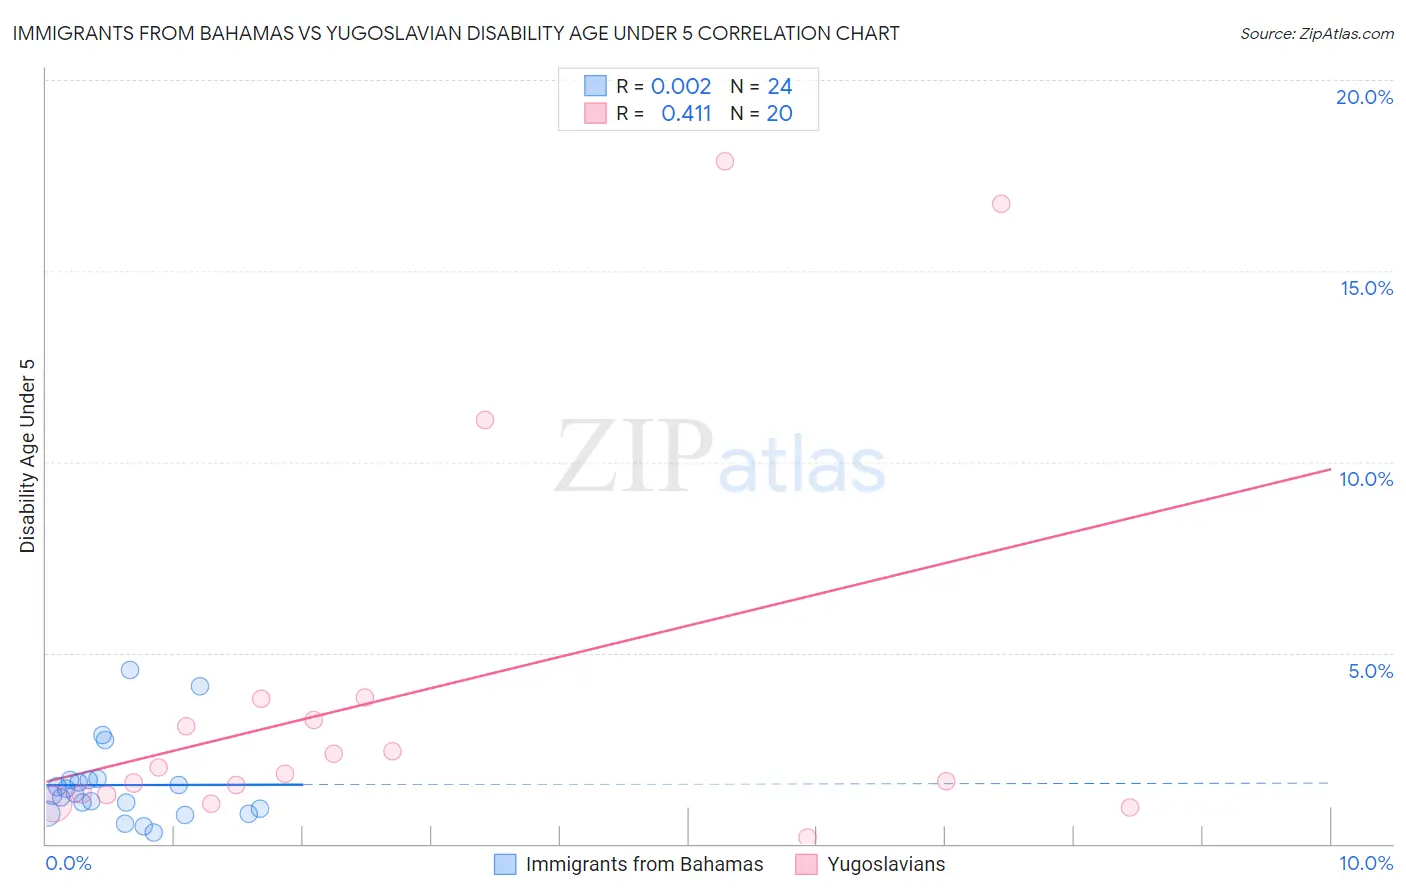
Immigrants from Bahamas vs Yugoslavian Disability Age Under 5 Correlation Chart
The statistical analysis conducted on geographies consisting of 77,902,509 people shows no correlation between the proportion of Immigrants from Bahamas and percentage of population with a disability under the age of 5 in the United States with a correlation coefficient (R) of 0.002 and weighted average of 1.2%. Similarly, the statistical analysis conducted on geographies consisting of 169,705,353 people shows a moderate positive correlation between the proportion of Yugoslavians and percentage of population with a disability under the age of 5 in the United States with a correlation coefficient (R) of 0.411 and weighted average of 1.4%, a difference of 14.2%.
Disability Age Under 5 Correlation Summary
| Measurement | Immigrants from Bahamas | Yugoslavian |
| Minimum | 0.28% | 0.18% |
| Maximum | 4.6% | 17.9% |
| Range | 4.3% | 17.7% |
| Mean | 1.5% | 3.9% |
| Median | 1.3% | 1.9% |
| Interquartile 25% (IQ1) | 0.85% | 1.3% |
| Interquartile 75% (IQ3) | 1.7% | 3.5% |
| Interquartile Range (IQR) | 0.82% | 2.2% |
| Standard Deviation (Sample) | 1.1% | 5.1% |
| Standard Deviation (Population) | 1.0% | 5.0% |
Similar Demographics by Disability Age Under 5
Demographics Similar to Immigrants from Bahamas by Disability Age Under 5
In terms of disability age under 5, the demographic groups most similar to Immigrants from Bahamas are Immigrants from Mexico (1.2%, a difference of 0.070%), Immigrants from Peru (1.2%, a difference of 0.13%), Macedonian (1.2%, a difference of 0.13%), Venezuelan (1.2%, a difference of 0.17%), and Immigrants from Saudi Arabia (1.2%, a difference of 0.17%).
| Demographics | Rating | Rank | Disability Age Under 5 |
| Crow | 51.0 /100 | #172 | Average 1.2% |
| Immigrants | Ireland | 50.3 /100 | #173 | Average 1.2% |
| Immigrants | Latvia | 50.0 /100 | #174 | Average 1.2% |
| Immigrants | Nigeria | 50.0 /100 | #175 | Average 1.2% |
| Immigrants | Kenya | 48.6 /100 | #176 | Average 1.2% |
| Comanche | 47.5 /100 | #177 | Average 1.2% |
| Venezuelans | 47.1 /100 | #178 | Average 1.2% |
| Immigrants | Bahamas | 45.2 /100 | #179 | Average 1.2% |
| Immigrants | Mexico | 44.4 /100 | #180 | Average 1.2% |
| Immigrants | Peru | 43.7 /100 | #181 | Average 1.2% |
| Macedonians | 43.7 /100 | #181 | Average 1.2% |
| Immigrants | Saudi Arabia | 43.3 /100 | #183 | Average 1.2% |
| Palestinians | 43.0 /100 | #184 | Average 1.2% |
| Immigrants | Western Africa | 42.5 /100 | #185 | Average 1.2% |
| Cubans | 42.5 /100 | #186 | Average 1.2% |
Demographics Similar to Yugoslavians by Disability Age Under 5
In terms of disability age under 5, the demographic groups most similar to Yugoslavians are Carpatho Rusyn (1.4%, a difference of 0.040%), Immigrants from Germany (1.4%, a difference of 0.080%), Spanish (1.4%, a difference of 0.15%), Immigrants from Dominica (1.4%, a difference of 0.21%), and Immigrants from Netherlands (1.4%, a difference of 0.37%).
| Demographics | Rating | Rank | Disability Age Under 5 |
| Slovenes | 0.3 /100 | #257 | Tragic 1.4% |
| Costa Ricans | 0.3 /100 | #258 | Tragic 1.4% |
| Immigrants | Southern Europe | 0.3 /100 | #259 | Tragic 1.4% |
| Slavs | 0.3 /100 | #260 | Tragic 1.4% |
| Immigrants | Netherlands | 0.2 /100 | #261 | Tragic 1.4% |
| Immigrants | Dominica | 0.2 /100 | #262 | Tragic 1.4% |
| Spanish | 0.2 /100 | #263 | Tragic 1.4% |
| Yugoslavians | 0.1 /100 | #264 | Tragic 1.4% |
| Carpatho Rusyns | 0.1 /100 | #265 | Tragic 1.4% |
| Immigrants | Germany | 0.1 /100 | #266 | Tragic 1.4% |
| Cree | 0.1 /100 | #267 | Tragic 1.4% |
| Belgians | 0.1 /100 | #268 | Tragic 1.4% |
| Austrians | 0.1 /100 | #269 | Tragic 1.4% |
| Immigrants | North America | 0.1 /100 | #270 | Tragic 1.4% |
| Immigrants | Canada | 0.1 /100 | #271 | Tragic 1.4% |