Immigrants from Bahamas vs Immigrants from Scotland Disability Age Under 5
COMPARE
Immigrants from Bahamas
Immigrants from Scotland
Disability Age Under 5
Disability Age Under 5 Comparison
Immigrants from Bahamas
Immigrants from Scotland
1.2%
DISABILITY AGE UNDER 5
45.2/ 100
METRIC RATING
179th/ 347
METRIC RANK
1.4%
DISABILITY AGE UNDER 5
0.9/ 100
METRIC RATING
252nd/ 347
METRIC RANK
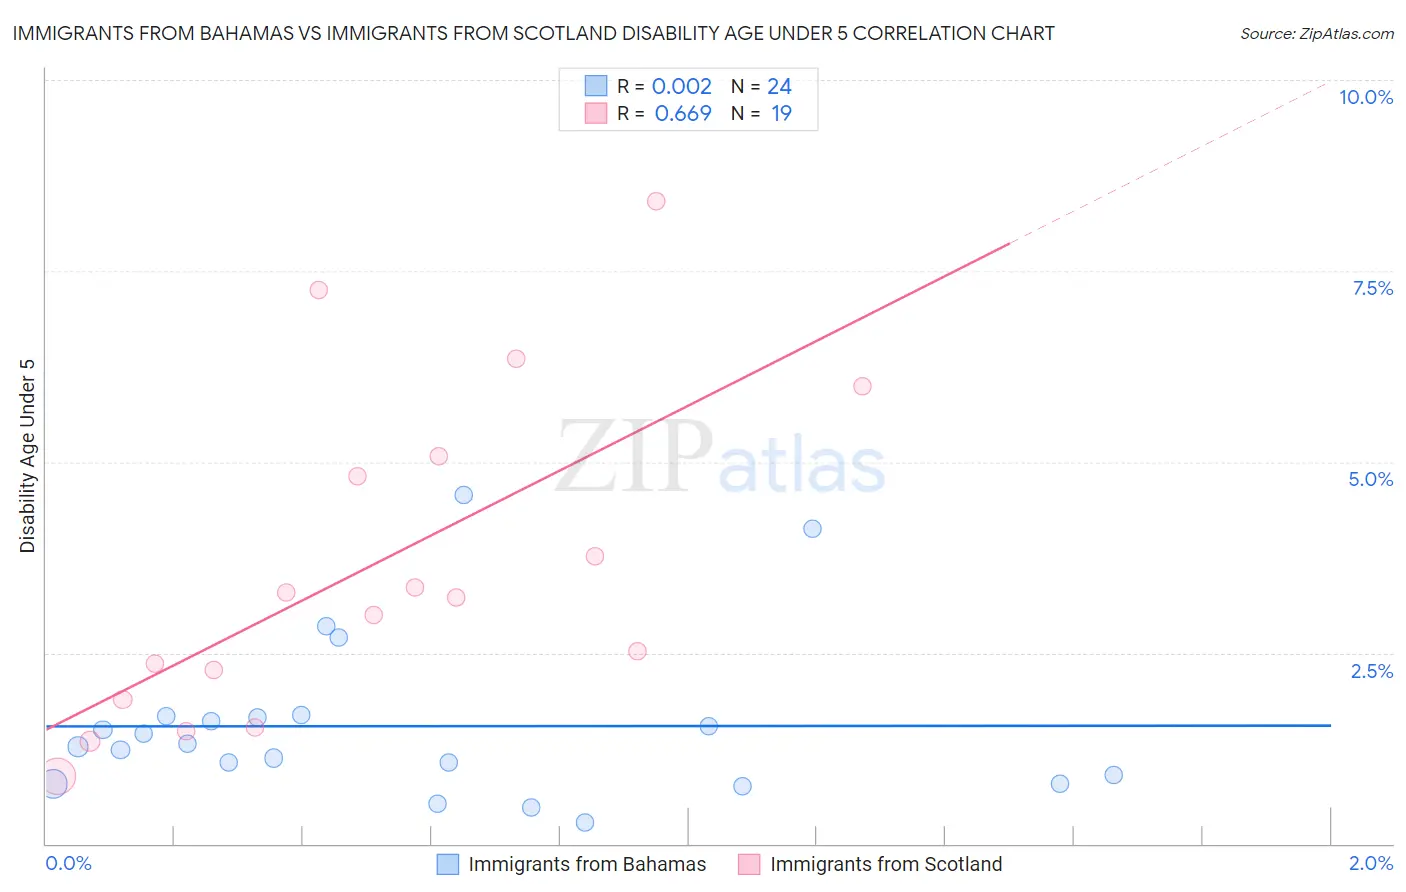
Immigrants from Bahamas vs Immigrants from Scotland Disability Age Under 5 Correlation Chart
The statistical analysis conducted on geographies consisting of 77,902,509 people shows no correlation between the proportion of Immigrants from Bahamas and percentage of population with a disability under the age of 5 in the United States with a correlation coefficient (R) of 0.002 and weighted average of 1.2%. Similarly, the statistical analysis conducted on geographies consisting of 125,019,989 people shows a significant positive correlation between the proportion of Immigrants from Scotland and percentage of population with a disability under the age of 5 in the United States with a correlation coefficient (R) of 0.669 and weighted average of 1.4%, a difference of 10.1%.
Disability Age Under 5 Correlation Summary
| Measurement | Immigrants from Bahamas | Immigrants from Scotland |
| Minimum | 0.28% | 0.88% |
| Maximum | 4.6% | 8.4% |
| Range | 4.3% | 7.5% |
| Mean | 1.5% | 3.6% |
| Median | 1.3% | 3.2% |
| Interquartile 25% (IQ1) | 0.85% | 1.9% |
| Interquartile 75% (IQ3) | 1.7% | 5.1% |
| Interquartile Range (IQR) | 0.82% | 3.2% |
| Standard Deviation (Sample) | 1.1% | 2.1% |
| Standard Deviation (Population) | 1.0% | 2.1% |
Similar Demographics by Disability Age Under 5
Demographics Similar to Immigrants from Bahamas by Disability Age Under 5
In terms of disability age under 5, the demographic groups most similar to Immigrants from Bahamas are Immigrants from Mexico (1.2%, a difference of 0.070%), Immigrants from Peru (1.2%, a difference of 0.13%), Macedonian (1.2%, a difference of 0.13%), Venezuelan (1.2%, a difference of 0.17%), and Immigrants from Saudi Arabia (1.2%, a difference of 0.17%).
| Demographics | Rating | Rank | Disability Age Under 5 |
| Crow | 51.0 /100 | #172 | Average 1.2% |
| Immigrants | Ireland | 50.3 /100 | #173 | Average 1.2% |
| Immigrants | Latvia | 50.0 /100 | #174 | Average 1.2% |
| Immigrants | Nigeria | 50.0 /100 | #175 | Average 1.2% |
| Immigrants | Kenya | 48.6 /100 | #176 | Average 1.2% |
| Comanche | 47.5 /100 | #177 | Average 1.2% |
| Venezuelans | 47.1 /100 | #178 | Average 1.2% |
| Immigrants | Bahamas | 45.2 /100 | #179 | Average 1.2% |
| Immigrants | Mexico | 44.4 /100 | #180 | Average 1.2% |
| Immigrants | Peru | 43.7 /100 | #181 | Average 1.2% |
| Macedonians | 43.7 /100 | #181 | Average 1.2% |
| Immigrants | Saudi Arabia | 43.3 /100 | #183 | Average 1.2% |
| Palestinians | 43.0 /100 | #184 | Average 1.2% |
| Immigrants | Western Africa | 42.5 /100 | #185 | Average 1.2% |
| Cubans | 42.5 /100 | #186 | Average 1.2% |
Demographics Similar to Immigrants from Scotland by Disability Age Under 5
In terms of disability age under 5, the demographic groups most similar to Immigrants from Scotland are Immigrants from Hungary (1.4%, a difference of 0.040%), African (1.4%, a difference of 0.070%), Bermudan (1.4%, a difference of 0.080%), Eastern European (1.4%, a difference of 0.16%), and Immigrants from England (1.4%, a difference of 0.19%).
| Demographics | Rating | Rank | Disability Age Under 5 |
| Potawatomi | 1.1 /100 | #245 | Tragic 1.4% |
| Russians | 1.0 /100 | #246 | Tragic 1.4% |
| Immigrants | England | 1.0 /100 | #247 | Tragic 1.4% |
| Eastern Europeans | 1.0 /100 | #248 | Tragic 1.4% |
| Bermudans | 1.0 /100 | #249 | Tragic 1.4% |
| Africans | 1.0 /100 | #250 | Tragic 1.4% |
| Immigrants | Hungary | 1.0 /100 | #251 | Tragic 1.4% |
| Immigrants | Scotland | 0.9 /100 | #252 | Tragic 1.4% |
| Australians | 0.7 /100 | #253 | Tragic 1.4% |
| Immigrants | Brazil | 0.7 /100 | #254 | Tragic 1.4% |
| Immigrants | Liberia | 0.6 /100 | #255 | Tragic 1.4% |
| Immigrants | Western Europe | 0.5 /100 | #256 | Tragic 1.4% |
| Slovenes | 0.3 /100 | #257 | Tragic 1.4% |
| Costa Ricans | 0.3 /100 | #258 | Tragic 1.4% |
| Immigrants | Southern Europe | 0.3 /100 | #259 | Tragic 1.4% |